. 2010 Mar 16;107(11):5142-7.
doi: 10.1073/pnas.0912524107. Epub 2010 Mar 1.

Allele-specific tumor spectrum in pten knockin mice

Affiliations

Allele-specific tumor spectrum in pten knockin mice

Hui Wang et al. Proc Natl Acad Sci U S A. .

Abstract

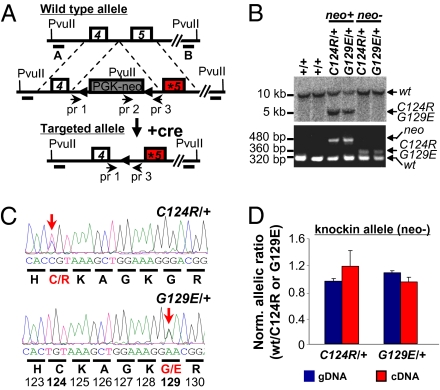
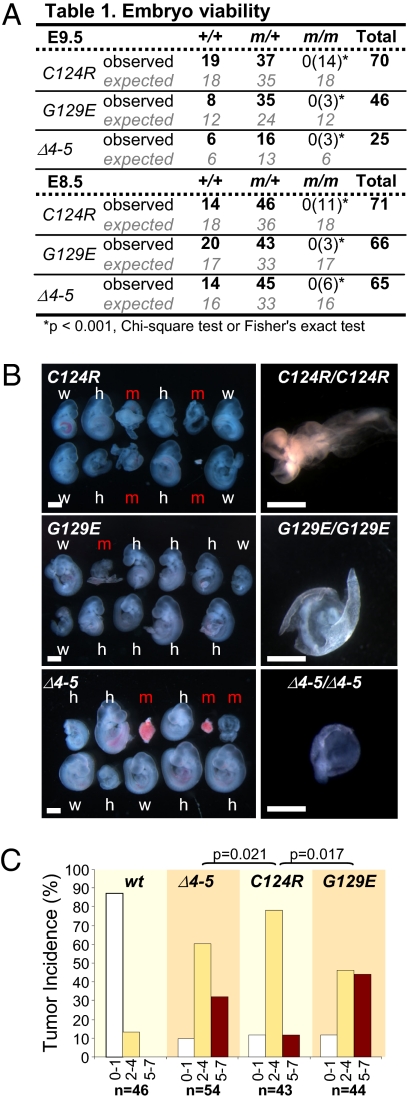
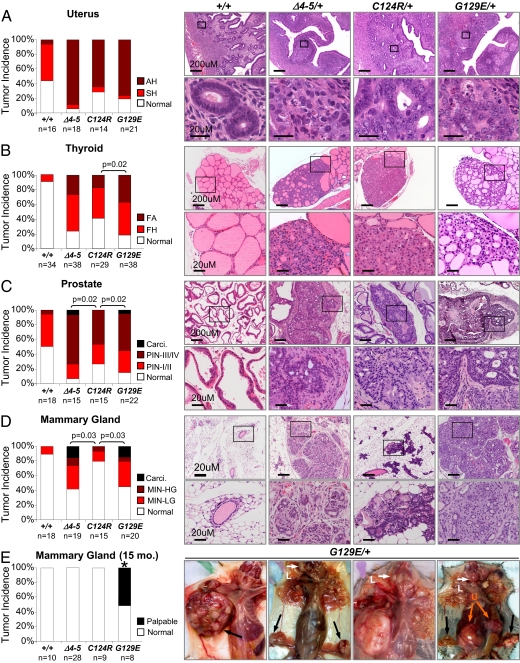
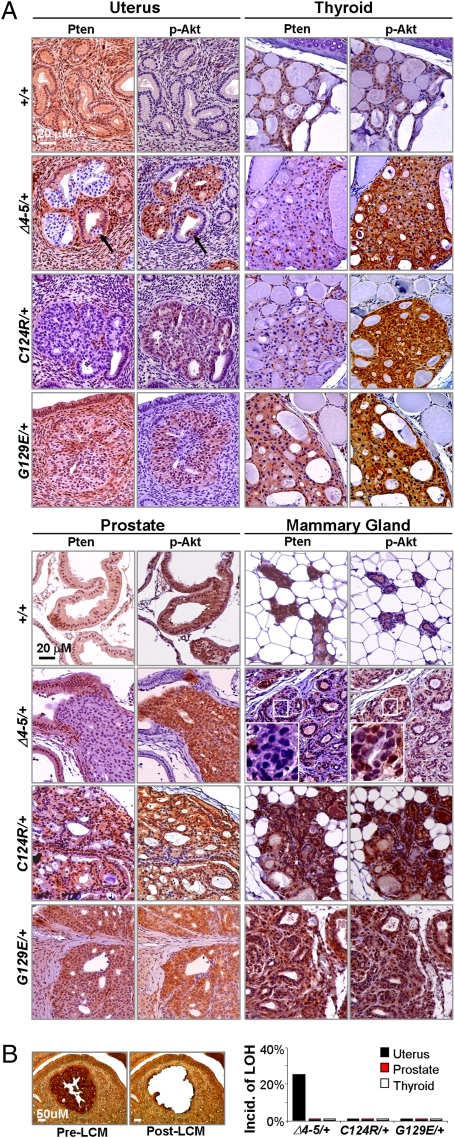
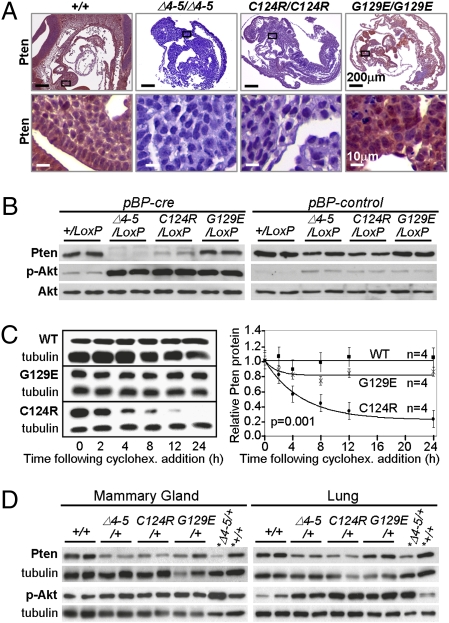
Germline mutations in the tumor suppressor gene PTEN (phosphatase and tensin homology deleted on chromosome 10) cause Cowden and Bannayan-Riley-Ruvalcaba (BRR) syndromes, two dominantly inherited disorders characterized by mental retardation, multiple hamartomas, and variable cancer risk. Here, we modeled three sentinel mutant alleles of PTEN identified in patients with Cowden syndrome and show that the nonsense Pten(4-5) and missense Pten(C124R) and Pten(G129E) alleles lacking lipid phosphatase activity cause similar developmental abnormalities but distinct tumor spectra with varying severity and age of onset. Allele-specific differences may be accounted for by loss of function for Pten(4-5), hypomorphic function for Pten(C124R), and gain of function for Pten(G129E). These data demonstrate that the variable tumor phenotypes observed in patients with Cowden and BRR syndromes can be attributed to specific mutations in PTEN that alter protein function through distinct mechanisms.


Conflict of interest statement

The authors declare no conflict of interest.

Figures

Fig. 1.
Fig. 1.
Generation, targeting, and verification of point mutations of Pten alleles. (A) Endogenous WT Pten allele (Top), the two targeted missense mutations in exon 5 (*) of Pten allele containing the selectable phosphoglycerate kinase promoter (PGK)-neo cassette (flanked by LoxP sites, triangles; Middle), and the two targeted mutant Pten knockin alleles (PtenC124R and PtenG129E) lacking the PGK-neo cassette (after mating with EIIA-cre-expressing mice; Bottom). A and B, DNA probes used for Southern blot analysis; pr, primers used for PCR genotyping. (B) Southern blot analysis (Upper) and genotyping PCR (Lower) of tail DNA with the indicated genotypes. Genomic DNA was digested with PvuII and probed with probe A, and expected band sizes are indicated for each allele. PCR amplification using primer pairs 1–3 and 2–3 (primer information provided in Table S3) yielded specific fragment size for different alleles as indicated. (C) Sequence analysis of tail DNA isolated from PtenC124R/+ and PtenG129E/+ mice. Chromatograms demonstrating the successful targeting of the Pten locus and translated amino acids are shown below the codons. Red letters and bold numbers denote the two targeted amino acids (C124R and G129E). Arrows point to targeted nucleotides. (D) Allelic expression imbalance analysis of allele-specific expression. The graph shows the proportion of mRNA expressed from the WT allele over the indicated mutant allele in lungs of PtenC124R/+ and PtenG129E/+ mice. neo−, mice lacking the PGK-neo cassette. Genomic DNA (gDNA) was used as an internal control.
Fig. 2.
Fig. 2.
Pten∆4–5, PtenC124R, and PtenG129E mutations cause early embryonic lethality and exhibit allele-specific tumor syndromes. (A) Offspring from Pten (PtenC124R, PtenG129E, or Pten∆4–5) heterozygous intercrosses were examined. The number of observed and expected E8.5 and E9.5 embryos is indicated. Fisher's exact or χ2 tests were used to compare differences between observed and expected homozygous embryos. The number of dead embryos is shown in parentheses. m, mutant allele (PtenC124R, PtenG129E, or Pten∆4–5). (B) (Left) Stereomicroscopic images of E9.5 WT (w), heterozygous (h), and homozygous (m) Pten-mutant littermate embryos. (Right) Higher magnification images of severely affected homozygous mutant embryos. (Scale bar: 1 mm.) (C) Organ distribution of tumor lesions in animals harboring the indicated Pten alleles. To simplify the graphical representation of data, mice were grouped based on the number of organs (0–1, white bars; 2–4, yellow bars; 5–7, red bars) afflicted with tumors. All uncategorized data were analyzed by Poisson regression methods, and significant differences are shown; all Pten mutant-WT allele comparisons were significant (P < 0.0001; not indicated).
Fig. 3.
Fig. 3.
Allele-specific and organ-specific tumor development in Pten∆4–5/+, PtenC124R/+, and PtenG129E/+ mice. Histopathological grades of lesions were compared between WT, Pten∆4–5/+, PtenC124R/+, and PtenG129E/+ 9-month-old mice in the uterus (A), thyroid (B), prostate (C), and mammary gland (D). Note the significant difference in the severity of lesions among the various animals with mutant Pten alleles. (Right) Histology with the highest grade lesions found in each genetic group. (Lower) Magnified view of the boxed region in the upper panels. Detailed histopathological criteria used to grade the lesions are included in Fig. S3. AH, atypical hyperplasia; SH, simple hyperplasia; PIN-I/II, prostatic intraepithelial neoplasia grade I or II; PIN-III/IV, prostatic intraepithelial neoplasia grade III or IV; FA, follicular adenoma; FH, follicular hyperplasia; Carci., carcinoma; MIN, mammary intraepithelial neoplasia; LG, low grade; HG, high grade; Normal, no gross or microscopic tumor. Comparisons between genetic groups in AD were analyzed by χ2 or Fisher's exact tests and adjusted by Holm's method. (E) Large palpable tumor masses in 12–15-month-old PtenG129E/+ female mice. Black and orange arrows point to mammary gland and uterine (U) tumors, respectively. White arrows point to enlarged lymph nodes (L). Normal, no gross mammary gland tumors; Palpable, palpable mammary gland tumors. Comparisons between genetic groups in E were analyzed by a binomial exact test. All comparisons between PtenG129E/+ and other genetic groups were found to be significant (*P < 0.01).
Fig. 4.
Fig. 4.
Expression of Pten and p-Akt in proliferative lesions of various organs. (A) Tissue sections from the uterus and thyroid (Upper) or prostate and mammary gland (Lower) of mice with the indicated genotypes were stained with Pten- and p-Akt-specific antibodies. Complete loss of Pten occurred in Pten∆4–5/+ lesions of the uterus, thyroid, and prostate, whereas decreased levels of Pten were observed in PtenC124R/+ lesions of the uterus and thyroid. Pten protein expression was lost in a mosaic fashion in advanced lesions of Pten∆4–5/+ mice but persisted in PtenC124R/+ MIN and PtenG129E/+ mammary gland carcinomas. (Right) Magnified images of the boxed region. (B) LOH analysis of WT Pten allele detected by PCR from laser capture microdissected (LCM) lesions of the uterus, prostate, and thyroid of 9-month-old heterozygotes. (Left) Representative images showing pre- and post-LCM tissue of “quick” p-Akt immunostained sections. (Right) Incidence of LOH in lesions from the indicated organs. For LOH in the uterus, 25 Pten∆4–5/+, 5 PtenC124R/+, and 5 PtenG129E/+ mice were examined. LOH in other organs was sampled from 5 mice per genotype group.
Fig. 5.
Fig. 5.
Decreased PtenC124R protein stability. (A) Pten IHC staining of homozygous embryos (E9.5) with the indicated genotypes. (Lower) High magnification of boxed areas in the upper panels. (B) Western blots of control- (pBP-control) or cre-retrovirus- (pBP-cre) infected MEFs of the indicated genotypes were probed with antibodies specific for Pten, p-Akt S473, and total Akt. Complete cre-mediated deletion of exons 4 and 5 was confirmed by PCR (Fig. S6B). (C) (Left) Western blots of cycloheximide- (cyclohex.) treated MEFs treated as in B and expressing WT Pten (WT), PtenC124R (C124R), and PtenG129E (G129E). (Right) Protein half-lives of WT Pten (WT), PtenC124R (C124R), and PtenG129E (G129E) were calculated as described in SI Text and plotted. n, number of independent experiments. ANOVA with a repeated-measures model was used to evaluate differences across the various time points and between genotypes. (D) Western blots of lysates derived from mammary glands and lungs of two 9-month-old female mice with the indicated genotypes probed with Pten- and p-Akt (S473)-specific antibodies as indicated. *Lysates derived from MEFs with the indicated genotypes were included in these blots. Tubulin protein levels were monitored as a loading control.

References

    1. Maehama T, Dixon JE. The tumor suppressor, PTEN/MMAC1, dephosphorylates the lipid second messenger, phosphatidylinositol 3,4,5-trisphosphate. J Biol Chem. 1998;273:13375–13378. - PubMed
    1. Li J, et al. PTEN, a putative protein tyrosine phosphatase gene mutated in human brain, breast, and prostate cancer. Science. 1997;275:1943–1947. - PubMed
    1. Myers MP, et al. P-TEN, the tumor suppressor from human chromosome 10q23, is a dual-specificity phosphatase. Proc Natl Acad Sci USA. 1997;94:9052–9057. - PMC - PubMed
    1. Manning BD, Cantley LC. AKT/PKB signaling: Navigating downstream. Cell. 2007;129:1261–1274. - PMC - PubMed
    1. Liaw D, et al. Germline mutations of the PTEN gene in Cowden disease, an inherited breast and thyroid cancer syndrome. Nat Genet. 1997;16:64–67. - PubMed

Publication types

MeSH terms