

Leptin therapy in insulin-deficient type I diabetes
- PMID: 20194735
- PMCID: PMC2841945
- DOI: 10.1073/pnas.0909422107
Leptin therapy in insulin-deficient type I diabetes
Abstract
In nonobese diabetic mice with uncontrolled type 1 diabetes, leptin therapy alone or combined with low-dose insulin reverses the catabolic state through suppression of hyperglucagonemia. Additionally, it mimics the anabolic actions of insulin monotherapy and normalizes hemoglobin A1c with far less glucose variability. We show that leptin therapy, like insulin, normalizes the levels of a wide array of hepatic intermediary metabolites in multiple chemical classes, including acylcarnitines, organic acids (tricarboxylic acid cycle intermediates), amino acids, and acyl CoAs. In contrast to insulin monotherapy, however, leptin lowers both lipogenic and cholesterologenic transcription factors and enzymes and reduces plasma and tissue lipids. The results imply that leptin administration may have multiple short- and long-term advantages over insulin monotherapy for type 1 diabetes.
Conflict of interest statement
The authors declare no conflict of interest.
Figures
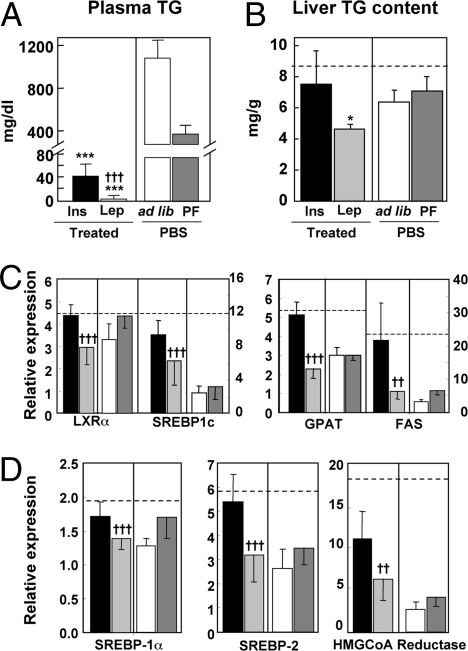
 ) or insulin delivered from an s.c. pellet (■). Untreated controls infused with PBS were either fed ad libitum (□) or pair-fed (PF) to the leptin-treated group (
 ). (A) Plasma TG concentration. (B) Liver TG content. (C) Hepatic expression of a lipogenic transcription factor, LXRα and SREBP-1c, and lipogenic enzymes, FAS and GPAT. (D) Hepatic expression of transcription factors, SREBP-1a and -2, and enzyme, HMG CoA reductase, involved in cholesterologenesis. Relative expression signifies the ratio of the mRNA of interest to the mRNA of 36B4, the invariant control. The broken horizontal lines indicate the relative expression level of the mRNA in nondiabetic control mice. [*P ≤ 0.05; **P ≤ 0.01; ***P ≤ 0.001 vs. ad libitum–fed untreated (PBF) controls; †P ≤ 0.05; ††P ≤ 0.01; †††P ≤ 0.001 leptin treatment vs. insulin.]
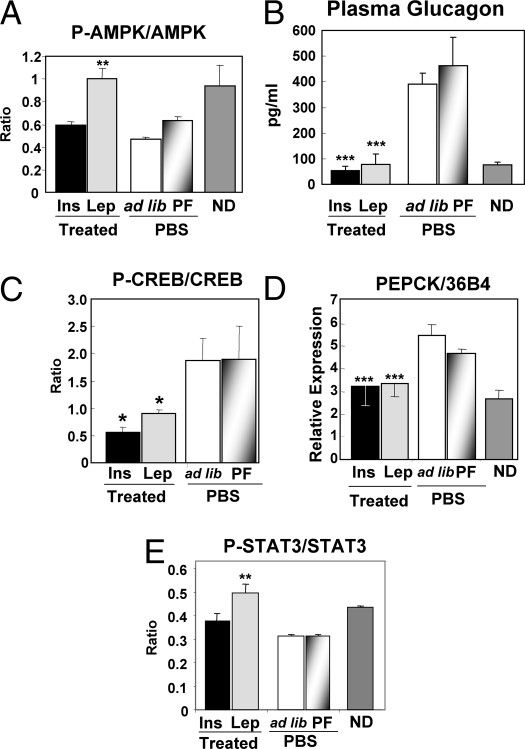
 ) or PEPCK insulin delivered from an s.c. pellet (■); untreated controls were infused with PBS and fed ad libitum (□) or PF to the leptin-treated group (
 ). (A) Ratio of phosphorylated to total AMPK. (B) Plasma glucagon. (C) Ratio of phosphorylated to total CREB. (D) mRNA of phosphoenol pyruvate carboxykinase. (E) Ratio of phosphorylated to total STAT-3. ND, nondiabetic. (*P ≤ 0.05; **P ≤ 0.01; ***P ≤ 0.001 vs. ad libitum fed untreated PBF controls.)
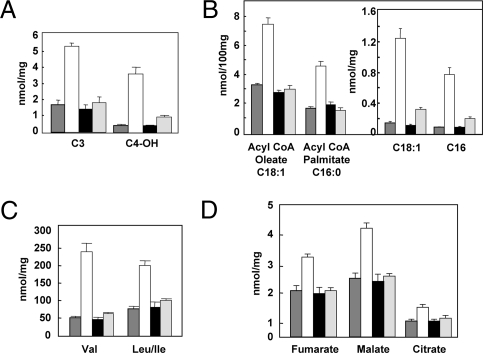
 ), untreated diabetic (□), diabetic treated with insulin pellets (■), and diabetic leptin-treated mice (
 ). (A) Acyl carnitines reflecting branch-chain amino acid metabolism and ketone production. (B) Long-chain acyl Co As and acyl carnitines (Inset). (C) Branch-chain amino acids. (D) Organic acids. Of 121 metabolites measured, 67 were abnormal in untreated diabetes. Of these, 55 were corrected or improved by both hormones. Three were corrected by leptin but not insulin. Three were corrected by insulin but not leptin. The remainder were not corrected.
Comment in
-
Leveraging leptin for type I diabetes?Proc Natl Acad Sci U S A. 2010 Mar 16;107(11):4793-4. doi: 10.1073/pnas.1000736107. Epub 2010 Mar 8. Proc Natl Acad Sci U S A. 2010. PMID: 20212134 Free PMC article. No abstract available.
References
-
- Banting FG, Best CH. Pancreatic extracts. 1922. J Lab Clin Med. 1990;115:254–272. - PubMed
-
- Boden G, Shulman GI. Free fatty acids in obesity and type 2 diabetes: Defining their role in the development of insulin resistance and beta-cell dysfunction. Eur J Clin Invest. 2002;32(Suppl 3):14–23. - PubMed
-
- Randle PJ, Garland PB, Hales CN, Newsholme EA. The glucose fatty-acid cycle. Its role in insulin sensitivity and the metabolic disturbances of diabetes mellitus. Lancet. 1963;1:785–789. - PubMed
Publication types
MeSH terms
Substances
LinkOut - more resources
Full Text Sources
Other Literature Sources
Medical
