Loss of high-frequency glucose-induced Ca2+ oscillations in pancreatic islets correlates with impaired glucose tolerance in Trpm5-/- mice
- PMID: 20194741
- PMCID: PMC2841940
- DOI: 10.1073/pnas.0913107107
Loss of high-frequency glucose-induced Ca2+ oscillations in pancreatic islets correlates with impaired glucose tolerance in Trpm5-/- mice
Abstract
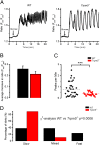
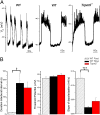
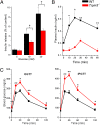
Glucose homeostasis is critically dependent on insulin release from pancreatic beta-cells, which is strictly regulated by glucose-induced oscillations in membrane potential (V(m)) and the cytosolic calcium level ([Ca(2+)](cyt)). We propose that TRPM5, a Ca(2+)-activated monovalent cation channel, is a positive regulator of glucose-induced insulin release. Immunofluorescence revealed expression of TRPM5 in pancreatic islets. A Ca(2+)-activated nonselective cation current with TRPM5-like properties is significantly reduced in Trpm5(-/-) cells. Ca(2+)-imaging and electrophysiological analysis show that glucose-induced oscillations of V(m) and [Ca(2+)](cyt) have on average a reduced frequency in Trpm5(-/-) islets, specifically due to a lack of fast oscillations. As a consequence, glucose-induced insulin release from Trpm5(-/-) pancreatic islets is significantly reduced, resulting in an impaired glucose tolerance in Trpm5(-/-) mice.
Conflict of interest statement
The authors declare no conflict of interest.
Figures


Similar articles
-
TRPM5 regulates glucose-stimulated insulin secretion.Pflugers Arch. 2010 Jun;460(1):69-76. doi: 10.1007/s00424-010-0835-z. Pflugers Arch. 2010. PMID: 20393858 Free PMC article.
-
Insulin downregulates the expression of the Ca2+-activated nonselective cation channel TRPM5 in pancreatic islets from leptin-deficient mouse models.Pflugers Arch. 2014 Mar;466(3):611-21. doi: 10.1007/s00424-013-1389-7. Epub 2013 Nov 13. Pflugers Arch. 2014. PMID: 24221356 Free PMC article.
-
Adding efficiency: the role of the CAN ion channels TRPM4 and TRPM5 in pancreatic islets.Islets. 2010 Sep-Oct;2(5):337-8. doi: 10.4161/isl.2.5.13140. Epub 2010 Sep 1. Islets. 2010. PMID: 21099334
-
TRPM5.Handb Exp Pharmacol. 2014;222:489-502. doi: 10.1007/978-3-642-54215-2_19. Handb Exp Pharmacol. 2014. PMID: 24756718 Review.
-
TRPM5 in the battle against diabetes and obesity.Acta Physiol (Oxf). 2018 Feb;222(2). doi: 10.1111/apha.12949. Epub 2017 Oct 4. Acta Physiol (Oxf). 2018. PMID: 28834354 Review.
Cited by
-
RNA-sequencing of WFS1-deficient pancreatic islets.Physiol Rep. 2016 Apr;4(7):e12750. doi: 10.14814/phy2.12750. Physiol Rep. 2016. PMID: 27053292 Free PMC article.
-
Enhanced insulin clearance in mice lacking TRPM8 channels.Am J Physiol Endocrinol Metab. 2013 Jul 1;305(1):E78-88. doi: 10.1152/ajpendo.00542.2012. Epub 2013 May 7. Am J Physiol Endocrinol Metab. 2013. PMID: 23651844 Free PMC article.
-
Sugar causes obesity and metabolic syndrome in mice independently of sweet taste.Am J Physiol Endocrinol Metab. 2020 Aug 1;319(2):E276-E290. doi: 10.1152/ajpendo.00529.2019. Epub 2020 Jun 23. Am J Physiol Endocrinol Metab. 2020. PMID: 32574112 Free PMC article.
-
Expression of transient receptor potential ankyrin 1 (TRPA1) and its role in insulin release from rat pancreatic beta cells.PLoS One. 2012;7(5):e38005. doi: 10.1371/journal.pone.0038005. Epub 2012 May 31. PLoS One. 2012. PMID: 22701540 Free PMC article.
-
TRPM5 regulates glucose-stimulated insulin secretion.Pflugers Arch. 2010 Jun;460(1):69-76. doi: 10.1007/s00424-010-0835-z. Pflugers Arch. 2010. PMID: 20393858 Free PMC article.
References
-
- Ashcroft FM, Rorsman P. Electrophysiology of the pancreatic beta-cell. Prog Biophys Mol Biol. 1989;54:87–143. - PubMed
-
- Wiederkehr A, Wollheim CB. Impact of mitochondrial calcium on the coupling of metabolism to insulin secretion in the pancreatic beta-cell. Cell Calcium. 2008;44:64–76. - PubMed
-
- Henquin JC, Meissner HP. Significance of ionic fluxes and changes in membrane potential for stimulus-secretion coupling in pancreatic B-cells. Experientia. 1984;40:1043–1052. - PubMed
Publication types
MeSH terms
Substances
Grants and funding
LinkOut - more resources
Full Text Sources
Other Literature Sources
Molecular Biology Databases
Research Materials
Miscellaneous

