. 2010 Mar 16;107(11):5012-7.
doi: 10.1073/pnas.1000896107. Epub 2010 Mar 1.

Dose-dependent induction of distinct phenotypic responses to Notch pathway activation in mammary epithelial cells

Affiliations

Dose-dependent induction of distinct phenotypic responses to Notch pathway activation in mammary epithelial cells

Marco Mazzone et al. Proc Natl Acad Sci U S A. .

Abstract

Aberrant activation of Notch receptors has been implicated in breast cancer; however, the mechanisms contributing to Notch-dependent transformation remain elusive because Notch displays dichotomous functional activities, promoting both proliferation and growth arrest. We investigated the cellular basis for the heterogeneous responses to Notch pathway activation in 3D cultures of MCF-10A mammary epithelial cells. Expression of a constitutively active Notch-1 intracellular domain (NICD) was found to induce two distinct types of 3D structures: large, hyperproliferative structures and small, growth-arrested structures with reduced cell-to-matrix adhesion. Interestingly, we found that these heterogeneous phenotypes reflect differences in Notch pathway activation levels; high Notch activity caused down-regulation of multiple matrix-adhesion genes and inhibition of proliferation, whereas low Notch activity maintained matrix adhesion and provoked a strong hyperproliferative response. Moreover, microarray analyses implicated NICD-induced p63 down-regulation in loss of matrix adhesion. In addition, a reverse-phase protein array-based analysis and subsequent loss-of-function studies identified STAT3 as a dominant downstream mediator of the NICD-induced outgrowth. These results indicate that the phenotypic responses to Notch are determined by the dose of pathway activation; and this dose affects the balance between growth-stimulative and growth-suppressive effects. This unique feature of Notch signaling provides insights into mechanisms that contribute to the dichotomous effects of Notch during development and tumorigenesis.


Conflict of interest statement

The authors declare no conflict of interest.

Figures

Fig. 1.
Fig. 1.
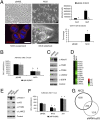
NICD induces heterogeneous phenotypes in 3D cultures of mammary epithelial cells. (A) Control (pBABE) or NICD-overexpressing (NICD) MCF-10A cells were cultured in Matrigel for 2 weeks. The phase-contrast images show representative 3D structures. (Scale bars, 100 μm.) Inserts show the absence of 3D structures from cells cultured in absence of EGF. (Bottom panels) The fluorescent confocal microscopy images show staining for βcatenin (red), Ki67 (green), and DAPI (blue). The arrows indicate representative abortive 3D structures. (Scale bar, 100 μm.) (B) (Top) Data represent the mean number of counted acinar 3D structures. Error bars show ± SD of three replicate samples from one representative experiment. Two fields were counted together per sample. *, P < 0.001 relative to control. (Middle) The mean acinar structure area data are represented as pixel2 and were obtained using ImageJ software. Error bars show ± SD of three replicate samples from one representative experiment. At least five fields were counted for sample. *, P < 0.01 relative to control. (Bottom) Ratio of the number of acinar structures or abortive structures relative to the total number of 3D structures.
Fig. 2.
Fig. 2.
NICD induces cell-to-matrix detachment. (A) Evidence of cell detachment and cell-in-cell structures in MCF-10A cells overexpressing NICD. (Upper) Representative phase-contrast images of MCF-10A cells stably infected with control (pBABE) or NICD-encoding retroviral vectors 48 h after replating. These cells also were seeded on day 0 in triplicate at 10 × 103 per well in six-well plates in growth medium. Attached cells then were trypsinized and counted with a hemacytometer on days 3 and 5. Error bars show ± SD of three replicate samples from one representative experiment. *, P < 0.001 relative to control. (Lower) The confocal image shows representative cell-in-cell structures induced by NICD in suspension and stained for βcatenin (red) and DAPI (blue). The phase-contrast image shows a representative cell-in-cell structure induced by NICD in attached cell monolayers. The percentage of similar structures also was determined by manual counting with a 100× objective. Error bars show ± SD of three replicate samples from one representative experiment. At least five fields were counted for sample. *, P < 0.005 relative to control. (Scale bars, 20 μm.) (B) Quantitation of the effect of NICD overexpression on cell adhesion to extracellular matrix. Cells infected with the indicated viral vectors were plated on dishes coated with mouse laminin-1 or basement membrane components for 2 h, and adherent cells were quantified following 1-h incubation with calcein acetoxymethyl ester at 37 °C. Fluorescence was measured at 485–520 nm. Values represent the mean ± SD of three replicate samples from one representative experiment. *, P < 0.01 relative to control. (C) Down-regulation of matrix-to-cell adhesion proteins by NICD. Lysates derived from MCF-10A cells infected with pBABE or NICD retroviruses were analyzed by Western blotting with the indicated antibodies. (D) The heat map shows down-regulation of integrins and ECM components by NICD at the transcriptional level. Gene-expression profiling of MCF-10A cells infected with pBABE (control) or NICD retroviruses was performed in triplicate. These data were analyzed as described in SI Material and Methods. (E) MCF-10A cells infected with the indicated retroviral vectors were analyzed by Western blotting with the indicated antibodies. (F) The same cell lines as in E were plated on dishes coated with mouse laminin-1 or basement membrane components for 1 h; then adherent cells were quantified as described above. Values represent the mean ± SD of three replicate samples from one representative experiment. *, P < 0.001 relative to control. (G) Comparative analysis of microarray data generated from analysis of control and NICD-expressing MCF-10A cells or from control and p63–down-regulated MCF-10A cells (20).
Fig. 3.
Fig. 3.
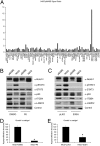
NICD-induced hyperproliferative response requires STAT3 activation. (A) RPPA profile of MCF-10A cells 48 h after infection with pBABE or NICD. Values represent the ratios (NICD/pBABE) of one experiment (three replicate samples). (B and C) STAT3 inhibition does not affect the NICD-induced down-regulation of p63 and ECM components. The indicated cell lines were analyzed by Western blotting with the indicated antibodies. Where indicated, the cell lines were treated with the pan-JAK inhibitor P6 (1 μM) (Calbiochem) or infected with S3SH, an shRNA lentivirus targeting STAT3 mRNA. (D and E) STAT3 inhibition affects the outgrowth of hyperproliferative structures induced by NICD in MCF-10A cells. Cells infected with retroviral vectors encoding the indicated genes were grown in Matrigel for 2 weeks. Where indicated, the cultures were fed with P6 once a week. Data show the mean number of hyperproliferative acinar structures (defined as structures larger than control 3D acinar structures) per eight-chamber culture of 6,000 cells. Error bars show ± SD of three replicate samples from one representative experiment. The total number of structures per chamber was counted. *, P < 0.001 (D) or <0.005 (E).
Fig. 4.
Fig. 4.
The heterogeneous phenotypes induced by Notch in 3D reflect differences in the expression levels of NICD-IRES-GFP and cell–matrix adhesion genes. Representative confocal images of 3D structures induced by control-IRES-GFP and NICD-IRES-GFP vectors after 2 weeks. (Upper) ITGB1 (red), GFP (green), and DAPI (blue); (Lower) LAMC2 (red), GFP (green), and DAPI (blue). The arrows indicate the presence of abortive structures. Of note, control-IRES-GFP induces normal acinar structures independent of GFP expression levels. (Scale bars, 100 μm.)
Fig. 5.
Fig. 5.
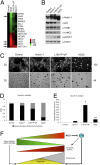
Dose-dependent regulation of the heterogeneous phenotypes induced by Notch pathway activation. (A) The transcriptional changes in genes from the Notch signaling pathway GeneGO category were analyzed as described in SI Material and Methods. The black arrows indicate that JAG2, JAG1, and HEY1 are significantly affected by L1601P+∆P at this threshold (FDR-corrected P < 0.05; fold change >1.5). (B) MCF-10A cells expressing wild-type Notch-1, L1601P+∆P mutant, and NICD were sorted by FACS; cell populations expressing similar levels of GFP were isolated and analyzed by Western blotting with the indicated antibodies. (C) Heterogeneous phenotypes induced by different variants of Notch-1 receptor. Representative images of the cellular phenotypes induced in 2D and 3D cultures are shown for each cell line. (D) The ratio between the number of acinar structures (defined as structures at least as large as controls) and the number of abortive structures relative to the total number of structures was determined by manual counting. (E) Data were obtained as the mean number of hyperproliferative acinar structures (defined as structures larger than control acinar structures) developed after 2 weeks in Matrigel. Error bars show SD of three replicate samples from one representative experiment. *, P < 0.001 and **, P < 0.005 relative to Notch-1. (F) Proposed dose-dependent model for Notch pathway involvement in the control of clonal outgrowth of mammary epithelial cells.

Similar articles

Cited by

References

    1. Artavanis-Tsakonas S, Matsuno K, Fortini ME. Notch signaling. Science. 1995;268:225–232. - PubMed
    1. Artavanis-Tsakonas S, Rand MD, Lake RJ. Notch signaling: Cell fate control and signal integration in development. Science. 1999;284:770–776. - PubMed
    1. Radtke F, Raj K. The role of Notch in tumorigenesis: Oncogene or tumour suppressor? Nat Rev Cancer. 2003;3:756–767. - PubMed
    1. Rizzo P, et al. Rational targeting of Notch signaling in cancer. Oncogene. 2008;27:5124–5131. - PubMed
    1. Weng AP, et al. Activating mutations of NOTCH1 in human T cell acute lymphoblastic leukemia. Science. 2004;306:269–271. - PubMed

Publication types