. 2010 Mar 16;107(11):5124-9.
doi: 10.1073/pnas.0911929107. Epub 2010 Mar 1.

Activin A promotes multiple myeloma-induced osteolysis and is a promising target for myeloma bone disease

Affiliations

Activin A promotes multiple myeloma-induced osteolysis and is a promising target for myeloma bone disease

Sonia Vallet et al. Proc Natl Acad Sci U S A. .

Abstract

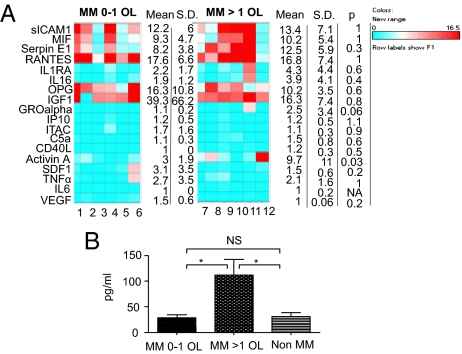
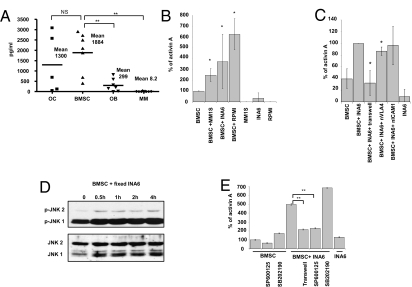
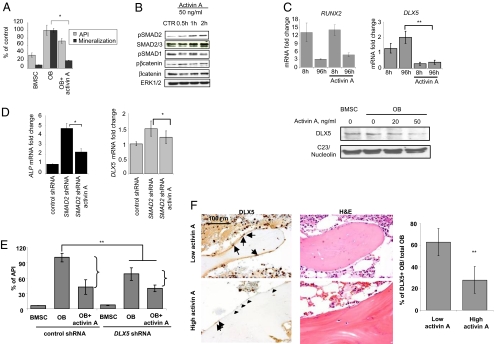
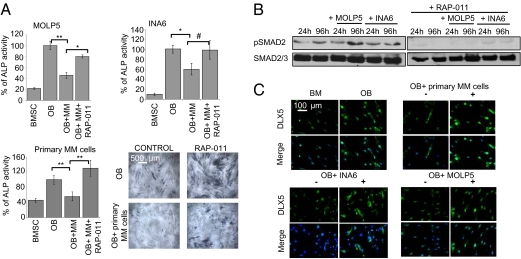
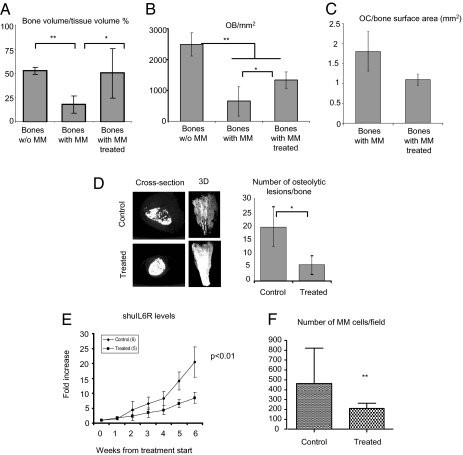
Understanding the pathogenesis of cancer-related bone disease is crucial to the discovery of new therapies. Here we identify activin A, a TGF-beta family member, as a therapeutically amenable target exploited by multiple myeloma (MM) to alter its microenvironmental niche favoring osteolysis. Increased bone marrow plasma activin A levels were found in MM patients with osteolytic disease. MM cell engagement of marrow stromal cells enhanced activin A secretion via adhesion-mediated JNK activation. Activin A, in turn, inhibited osteoblast differentiation via SMAD2-dependent distal-less homeobox-5 down-regulation. Targeting activin A by a soluble decoy receptor reversed osteoblast inhibition, ameliorated MM bone disease, and inhibited tumor growth in an in vivo humanized MM model, setting the stage for testing in human clinical trials.


Conflict of interest statement

Conflict of interest statement: J.S.S. is an employee of Acceleron Pharma. He provided RAP-011 but was not involved with the experimental design.

Figures

Fig. 1.
Fig. 1.
Activin A correlates with osteolytic disease in MM patients. (A) Cytokine profile of BM plasma from 12 MM patients with ≤1 OL (n = 6) or >1 OL (n = 6). The levels of 18 cytokines are represented as fold increase over the background. Average, SD, and P values are provided. (B) BM plasma levels of activin A were assessed by ELISA in MM patients with osteolytic disease (n = 15), MM patients with ≤1 OL (n = 13), and non-MM patients (n = 10). Error bars represent SEM. *P < 0.05, **P < 0.01.
Fig. 2.
Fig. 2.
BMSC secretion of activin A is induced by MM cells via JNK pathway activation. (A) Ex vivo–derived OCs (n = 5), BMSCs (n = 7), OBs (n = 7), and MM patient cells, as well as MM cell lines (n = 2 and n = 6, respectively) were cultured for 72 h, and ELISA for activin A was performed on the supernatant. (B) MM1.S, INA6, and RPMI cells were cocultured with BMSCs for 24 h and the supernatant was analyzed for activin A expression levels by ELISA. The graph shows a quantification of three independent experiments. (C) INA6 and BMSCs were cocultured for 24 h with or without a transwell system, neutralizing antibody against VLA-4 (5 μg/mL), and ICAM-1 (10 μg/mL). The supernatant was analyzed for activin A expression levels by ELISA. The graph shows a quantification of three independent experiments. (D) BMSC were cocultured with fixed INA6 MM cells and harvested at the indicated time points to analyze JNK phosphorylation by Western blotting. (E) INA6 and BMSCs were cocultured for 24 h with or without a transwell system. In the last 15 h of culture, JNK inhibitor (SP600125, 20 μM), p38 inhibitor (SP202190, 20 μM), or DMSO 0.1% were added. The supernatant was analyzed for activin A expression levels by ELISA. Error bars represent SD. *P < 0.05, **P < 0.01.
Fig. 3.
Fig. 3.
Activin A inhibits OB differentiation via DLX5 down-regulation. (A) Healthy donor–derived OBs were differentiated in the presence of activin A (50 ng/mL). ALP activity was detected after 2 weeks of differentiation with a chromogenic substrate and corrected for the number of viable cells quantified via AlamarBlue assay (i.e., API). OB activity was assessed at d 21 of differentiation by quantification of calcium deposits stained with alizarin red. (B) OBs were differentiated for 1 week and then incubated with activin A (50 ng/mL) for the indicated time points. Protein expression of phosphoSMAD2, SMAD2/3 phosphoSMAD1, phosphoß-catenin, β-catenin, and ERK1/2 were assessed by Western blot. (C) OBs were differentiated in the presence of activin A (50 ng/mL) for the indicated time points and the mRNA expression levels of RUNX2 (Left) and DLX5 (Middle) were assessed by quantitative-PCR. (Right) HS27-derived OBs were differentiated in the presence of various concentrations of activin A for 24 h. Nuclear protein extracts were performed to assess DLX5 and nucleolin expression. (D) After SMAD2 knockdown, BMSCs were stimulated with activin A (50 ng/mL) for 48 h and expression levels of ALP and DLX5 were assessed by quantitative PCR. (E) BMSCs were transduced with shRNA targeting DLX5 or control shRNA, and stimulated with activin A (50 ng/mL) in the presence of osteogenic media. ALP activity was detected after 10 d of differentiation with a chromogenic substrate and corrected for the number of viable cells quantified via AlamarBlue assay (i.e., API). (F) BM biopsies from MM patients with low (<50 pg/mL; n = 10) or high (≥50 pg/mL; n = 10) BM plasma levels of activin A were analyzed for DLX5 expression by IHC (counterstained with hematoxylin). The arrows indicate DLX5+ OBs and the arrowheads point at DLX5-OB. H&E staining of a corresponding field is also represented (Left). OB with nuclear expression of DLX5 were quantified and normalized against the total OB number (Right). Error bars represent SD. *P < 0.05, **P < 0.01.
Fig. 4.
Fig. 4.
Inhibition of activin A reverses MM-induced OB inhibition. (A) OBs from healthy donor or HS27 cell line were differentiated in the presence of MM cell lines MOLP5 (Upper Left) and INA6 (Upper Right), and MM primary cells (Lower Left), respectively, with or without the soluble receptor for activin A, RAP-011 (50 μg/mL). After 2 weeks of differentiation, ALP activity was assessed with a chromogenic substrate. Cells were stained for ALP and methyl green was used as nuclear counterstaining (Lower Right). (B) OBs were differentiated in the presence of MM cell lines MOLP5 and INA6 for the indicated time-points with or without RAP-011 (50 μg/mL) as demonstrated. After magnetic bead depletion of CD38+ MM cells, phosphoSMAD2 and SMAD2/3 expression levels were assessed in the OB fraction by Western blot. (C) OBs were differentiated in the presence of MM cell lines MOLP5 and INA6 as well as MM primary cells either in the absence (minus signs) or in the presence of RAP-011 50 μg/mL (plus signs). After 1 week of differentiation, cells were fixed and stained with antibodies against DLX5 and counterstained with DAPI. Error bars represent SD. #P = 0.05, *P < 0.05, **P < 0.01.
Fig. 5.
Fig. 5.
Inhibition of activin A with a soluble receptor, RAP-011, improves MM-related osteolytic disease and impairs MM cell growth in vivo. (A) Midsections of non–tumor-injected bones (n = 6) and tumor-injected bones harvested from, respectively, control (n = 4) and treated mice (n = 4) were stained for DAPI and H&E and photographed through its entire length at low power (40×). Bone volume was then quantified and corrected for the total tissue areas. (B) OBs were counted on H&E–stained slides and cell number expressed per tissue area (in mm2). (C) OCs were counted after TRAP staining and number expressed per bone surface area (in mm2). (D) A representative cross-section image and 3D reconstruction of the harvested human bones obtained performing high-resolution CT scan is shown. Osteolytic lesions, identified as low bone density, discrete, punctuate areas, were quantified on the 3D images from control (n = 4) and treated mice (n = 4). (E) Tumor growth was monitored as levels of circulating sHuIL6R, secreted by INA6 MM cells. (F) Midsections of each bone were photographed in GFP channel through its entire length at low power (40×) and GFP+ INA6 MM cells were counted. Error bars represent SD. *P < 0.05, **P < 0.01.

References

    1. Gupta GP, Massagué J. Cancer metastasis: building a framework. Cell. 2006;127:679–695. - PubMed
    1. Hideshima T, Mitsiades C, Tonon G, Richardson PG, Anderson KC. Understanding multiple myeloma pathogenesis in the bone marrow to identify new therapeutic targets. Natl Rev. 2007;7:585–598. - PubMed
    1. Michigami T, et al. Cell-cell contact between marrow stromal cells and myeloma cells via VCAM-1 and alpha(4)beta(1)-integrin enhances production of osteoclast-stimulating activity. Blood. 2000;96:1953–1960. - PubMed
    1. Roodman GD. New potential targets for treating myeloma bone disease. Clin Cancer Res. 2006;12:6270s–6273s. - PubMed
    1. Ikenoue T, Jingushi S, Urabe K, Okazaki K, Iwamoto Y. Inhibitory effects of activin-A on osteoblast differentiation during cultures of fetal rat calvarial cells. J Cell Biochem. 1999;75:206–214. - PubMed

Publication types

MeSH terms