

Distal axonopathy with structural persistence in glaucomatous neurodegeneration
- PMID: 20194762
- PMCID: PMC2841892
- DOI: 10.1073/pnas.0913141107
Distal axonopathy with structural persistence in glaucomatous neurodegeneration
Abstract
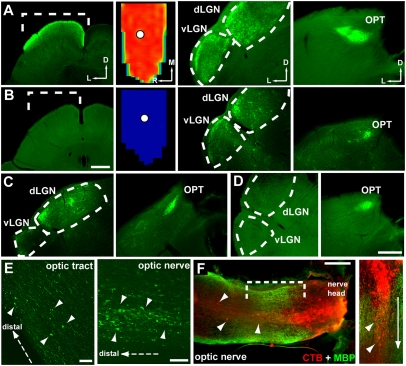
An early hallmark of neuronal degeneration is distal transport loss and axon pathology. Glaucoma involves the degeneration of retinal ganglion cell (RGC) neurons and their axons in the optic nerve. Here we show that, like other neurodegenerations, distal axon injury appears early in mouse glaucoma. Where RGC axons terminate in the superior colliculus, reduction of active transport follows a retinotopic pattern resembling glaucomatous vision loss. Like glaucoma, susceptibility to transport deficits increases with age and is not necessarily associated with elevated ocular pressure. Transport deficits progress distal-to-proximal, appearing in the colliculus first followed by more proximal secondary targets and then the optic tract. Transport persists through the optic nerve head before finally failing in the retina. Although axon degeneration also progresses distal-to-proximal, myelinated RGC axons and their presynaptic terminals persist in the colliculus well after transport fails. Thus, distal transport loss is predegenerative and may represent a therapeutic target.
Conflict of interest statement
The authors declare no conflict of interest.
Figures


Similar articles
-
CNS axonal degeneration and transport deficits at the optic nerve head precede structural and functional loss of retinal ganglion cells in a mouse model of glaucoma.Mol Neurodegener. 2020 Aug 27;15(1):48. doi: 10.1186/s13024-020-00400-9. Mol Neurodegener. 2020. PMID: 32854767 Free PMC article.
-
Critical pathogenic events underlying progression of neurodegeneration in glaucoma.Prog Retin Eye Res. 2012 Nov;31(6):702-19. doi: 10.1016/j.preteyeres.2012.07.001. Epub 2012 Aug 1. Prog Retin Eye Res. 2012. PMID: 22871543 Free PMC article. Review.
-
Assessment of retinal ganglion cell damage in glaucomatous optic neuropathy: Axon transport, injury and soma loss.Exp Eye Res. 2015 Dec;141:111-24. doi: 10.1016/j.exer.2015.06.006. Epub 2015 Jun 9. Exp Eye Res. 2015. PMID: 26070986 Review.
-
Enlarged Optic Nerve Axons and Reduced Visual Function in Mice with Defective Microfibrils.eNeuro. 2018 Oct 30;5(5):ENEURO.0260-18.2018. doi: 10.1523/ENEURO.0260-18.2018. eCollection 2018 Sep-Oct. eNeuro. 2018. PMID: 30406200 Free PMC article.
-
Interleukin-6 Deficiency Attenuates Retinal Ganglion Cell Axonopathy and Glaucoma-Related Vision Loss.Front Neurosci. 2017 May 31;11:318. doi: 10.3389/fnins.2017.00318. eCollection 2017. Front Neurosci. 2017. PMID: 28620279 Free PMC article.
Cited by
-
Axon hyperexcitability in the contralateral projection following unilateral optic nerve crush in mice.Brain Commun. 2022 Oct 3;4(5):fcac251. doi: 10.1093/braincomms/fcac251. eCollection 2022. Brain Commun. 2022. PMID: 36267329 Free PMC article.
-
Retrograde signaling in the optic nerve is necessary for electrical responsiveness of retinal ganglion cells.Invest Ophthalmol Vis Sci. 2013 Feb 1;54(2):1236-43. doi: 10.1167/iovs.12-11188. Invest Ophthalmol Vis Sci. 2013. PMID: 23307964 Free PMC article.
-
Using genetic mouse models to gain insight into glaucoma: Past results and future possibilities.Exp Eye Res. 2015 Dec;141:42-56. doi: 10.1016/j.exer.2015.06.019. Epub 2015 Jun 24. Exp Eye Res. 2015. PMID: 26116903 Free PMC article. Review.
-
Inhibition of the classical pathway of the complement cascade prevents early dendritic and synaptic degeneration in glaucoma.Mol Neurodegener. 2016 Apr 6;11:26. doi: 10.1186/s13024-016-0091-6. Mol Neurodegener. 2016. PMID: 27048300 Free PMC article.
-
Citicoline Eye Drops Protect Trabecular Meshwork Cells from Oxidative Stress Injury in a 3D In Vitro Glaucoma Model.Int J Mol Sci. 2022 Sep 27;23(19):11375. doi: 10.3390/ijms231911375. Int J Mol Sci. 2022. PMID: 36232676 Free PMC article.
References
-
- Quigley HA. Neuronal death in glaucoma. Prog Retin Eye Res. 1999;18:39–57. - PubMed
-
- Nickells RW. From ocular hypertension to ganglion cell death: a theoretical sequence of events leading to glaucoma. Can J Ophthalmol. 2007;42:278–287. - PubMed
-
- Heijl A, et al. Early Manifest Glaucoma Trial Group. Reduction of intraocular pressure and glaucoma progression: results from the Early Manifest Glaucoma Trial. Arch Ophthalmol. 2002;120:1268–1279. - PubMed
-
- Pease ME, McKinnon SJ, Quigley HA, Kerrigan-Baumrind LA, Zack DJ. Obstructed axonal transport of BDNF and its receptor TrkB in experimental glaucoma. Invest Ophthalmol Vis Sci. 2000;41:764–774. - PubMed
Publication types
MeSH terms
Grants and funding
LinkOut - more resources
Full Text Sources
Other Literature Sources
Medical
Molecular Biology Databases
