

Reduced voltage sensitivity in a K+-channel voltage sensor by electric field remodeling
- PMID: 20194763
- PMCID: PMC2841883
- DOI: 10.1073/pnas.1000963107
Reduced voltage sensitivity in a K+-channel voltage sensor by electric field remodeling
Abstract
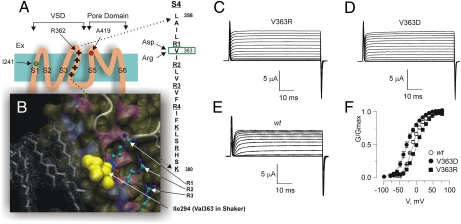
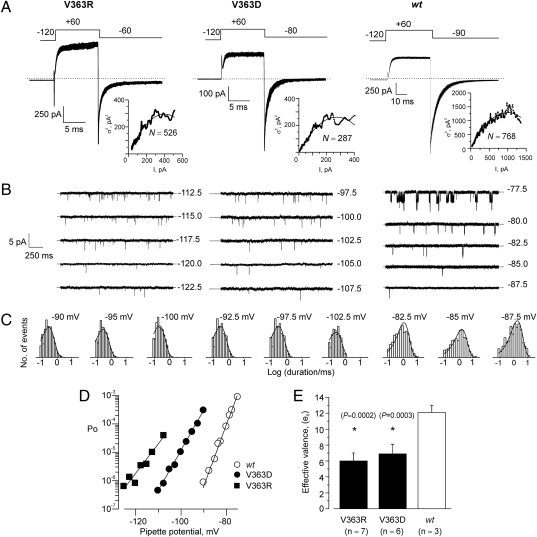
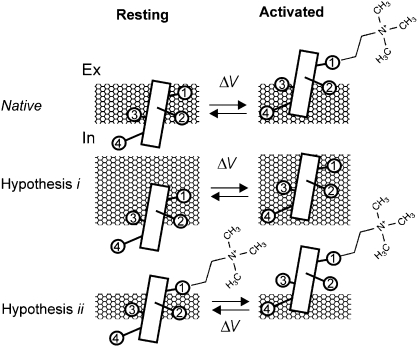
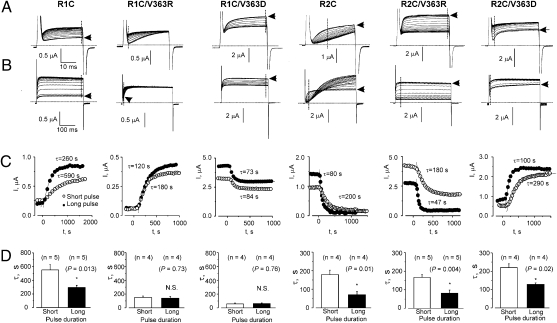
Propagation of the nerve impulse relies on the extreme voltage sensitivity of Na(+) and K(+) channels. The transmembrane movement of four arginine residues, located at the fourth transmembrane segment (S4), in each of their four voltage-sensing domains is mostly responsible for the translocation of 12 to 13 e(o) across the transmembrane electric field. Inserting additional positively charged residues between the voltage-sensing arginines in S4 would, in principle, increase voltage sensitivity. Here we show that either positively or negatively charged residues added between the two most external sensing arginines of S4 decreased voltage sensitivity of a Shaker voltage-gated K(+)-channel by up to approximately 50%. The replacement of Val363 with a charged residue displaced inwardly the external boundaries of the electric field by at least 6 A, leaving the most external arginine of S4 constitutively exposed to the extracellular space and permanently excluded from the electric field. Both the physical trajectory of S4 and its electromechanical coupling to open the pore gate seemed unchanged. We propose that the separation between the first two sensing charges at resting is comparable to the thickness of the low dielectric transmembrane barrier they must cross. Thus, at most a single sensing arginine side chain could be found within the field. The conserved hydrophobic nature of the residues located between the voltage-sensing arginines in S4 may shape the electric field geometry for optimal voltage sensitivity in voltage-gated ion channels.
Conflict of interest statement
The authors declare no conflict of interest.
Figures
Similar articles
-
Role of hydrophobic and ionic forces in the movement of S4 of the Shaker potassium channel.Mol Membr Biol. 2012 Dec;29(8):321-32. doi: 10.3109/09687688.2012.710343. Epub 2012 Aug 13. Mol Membr Biol. 2012. PMID: 22881396
-
Role of charged residues in the S1-S4 voltage sensor of BK channels.J Gen Physiol. 2006 Mar;127(3):309-28. doi: 10.1085/jgp.200509421. J Gen Physiol. 2006. PMID: 16505150 Free PMC article.
-
Functional extension of amino acid triads from the fourth transmembrane segment (S4) into its external linker in Shaker K(+) channels.J Biol Chem. 2011 Oct 28;286(43):37503-14. doi: 10.1074/jbc.M111.237792. Epub 2011 Sep 7. J Biol Chem. 2011. PMID: 21900243 Free PMC article.
-
Emerging issues of connexin channels: biophysics fills the gap.Q Rev Biophys. 2001 Aug;34(3):325-472. doi: 10.1017/s0033583501003705. Q Rev Biophys. 2001. PMID: 11838236 Review.
-
Involvement of the S4-S5 linker and the C-linker domain regions to voltage-gating in plant Shaker channels: comparison with animal HCN and Kv channels.Plant Signal Behav. 2014;9(10):e972892. doi: 10.4161/15592316.2014.972892. Plant Signal Behav. 2014. PMID: 25482770 Free PMC article. Review.
Cited by
-
Linkage analysis reveals allosteric coupling in Kir2.1 channels.J Gen Physiol. 2018 Nov 5;150(11):1541-1553. doi: 10.1085/jgp.201812127. Epub 2018 Oct 16. J Gen Physiol. 2018. PMID: 30327330 Free PMC article.
-
Trans-toxin ion-sensitivity of charybdotoxin-blocked potassium-channels reveals unbinding transitional states.Elife. 2019 Jul 4;8:e46170. doi: 10.7554/eLife.46170. Elife. 2019. PMID: 31271355 Free PMC article.
-
A novel theoretical framework reveals more than one voltage-sensing pathway in the lateral membrane of outer hair cells.J Gen Physiol. 2020 Jul 6;152(7):e201912447. doi: 10.1085/jgp.201912447. J Gen Physiol. 2020. PMID: 32384538 Free PMC article.
-
Gating-induced large aqueous volumetric remodeling and aspartate tolerance in the voltage sensor domain of Shaker K+ channels.Proc Natl Acad Sci U S A. 2018 Aug 7;115(32):8203-8208. doi: 10.1073/pnas.1806578115. Epub 2018 Jul 23. Proc Natl Acad Sci U S A. 2018. PMID: 30038023 Free PMC article.
-
Voltage-dependent gating and gating charge measurements in the Kv1.2 potassium channel.J Gen Physiol. 2015 Apr;145(4):345-58. doi: 10.1085/jgp.201411300. Epub 2015 Mar 16. J Gen Physiol. 2015. PMID: 25779871 Free PMC article.
References
-
- Aggarwal SK, MacKinnon R. Contribution of the S4 segment to gating charge in the Shaker K+ channel. Neuron. 1996;16:1169–1177. - PubMed
-
- Seoh SA, Sigg D, Papazian DM, Bezanilla F. Voltage-sensing residues in the S2 and S4 segments of the Shaker K+ channel. Neuron. 1996;16:1159–1167. - PubMed
-
- Bezanilla F. How membrane proteins sense voltage. Nat Rev Mol Cell Biol. 2008;9:323–332. - PubMed
Publication types
MeSH terms
Substances
LinkOut - more resources
Full Text Sources
