

Random cell movement promotes synchronization of the segmentation clock
- PMID: 20194769
- PMCID: PMC2841944
- DOI: 10.1073/pnas.0907122107
Random cell movement promotes synchronization of the segmentation clock
Abstract
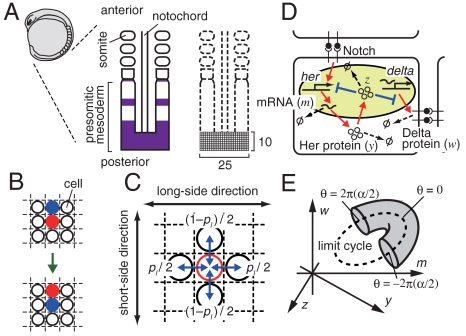
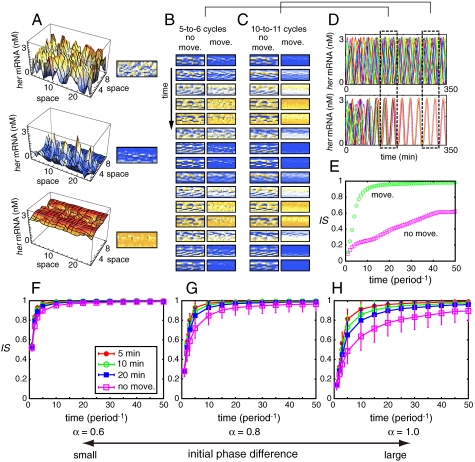
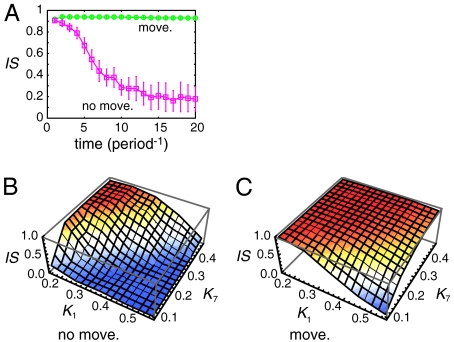
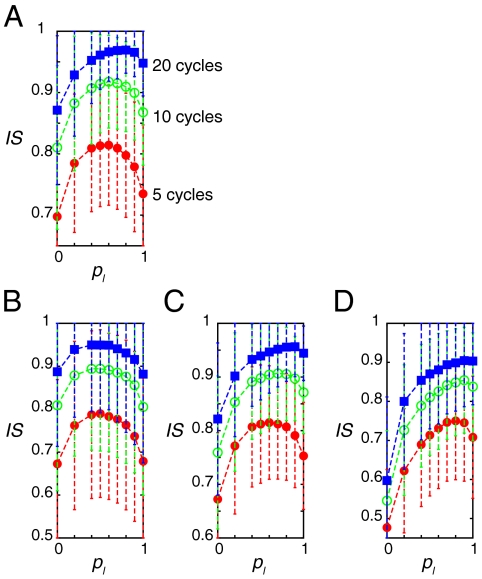
In vertebrate somitogenesis, the expression of segmentation clock genes oscillates and the oscillation is synchronized over nearby cells. Both experimental and theoretical studies have shown that the synchronization among cells is realized by intercellular interaction via Delta-Notch signaling. However, the following questions emerge: (i) During somitogenesis, dynamic rearrangement of relative cell positions is observed in the posterior presomitic mesoderm. Can a synchronized state be stably sustained under random cell movement? (ii) Experimental studies have reported that the synchronization of cells can be recovered in about 10 or fewer oscillation cycles after the complete loss of synchrony. However, such a quick recovery of synchronization is not possible according to previous theoretical models. In this paper, we first show by numerical modeling that synchronized oscillation can be sustained under random cell movement. We also find that for initial perturbation, the synchronization of cells is recovered much faster and it is for a wider range of reaction parameters than the case without cell movement. When the posterior presomitic mesoderm is rectangular, faster synchronization is achieved if cells exchange their locations more with neighbors located along the longer side of the domain. Finally, we discuss that the enhancement of synchronization by random cell movement occurs in several different models for the oscillation of segmentation clock genes.
Conflict of interest statement
The authors declare no conflict of interest.
Figures
Similar articles
-
Synchronized oscillation of the segmentation clock gene in vertebrate development.J Math Biol. 2010 Aug;61(2):207-229. doi: 10.1007/s00285-009-0296-1. Epub 2009 Sep 16. J Math Biol. 2010. PMID: 19756608
-
Traveling wave formation in vertebrate segmentation.J Theor Biol. 2009 Apr 7;257(3):385-96. doi: 10.1016/j.jtbi.2009.01.003. Epub 2009 Jan 9. J Theor Biol. 2009. PMID: 19174170
-
Collective cell movement promotes synchronization of coupled genetic oscillators.Biophys J. 2014 Jul 15;107(2):514-526. doi: 10.1016/j.bpj.2014.06.011. Biophys J. 2014. PMID: 25028893 Free PMC article.
-
Segmentation of the paraxial mesoderm and vertebrate somitogenesis.Curr Top Dev Biol. 2000;47:81-105. doi: 10.1016/s0070-2153(08)60722-x. Curr Top Dev Biol. 2000. PMID: 10595302 Review.
-
What are you synching about? Emerging complexity of Notch signaling in the segmentation clock.Dev Biol. 2020 Apr 1;460(1):40-54. doi: 10.1016/j.ydbio.2019.06.024. Epub 2019 Jul 11. Dev Biol. 2020. PMID: 31302101 Review.
Cited by
-
Systems approach to developmental biology--designs for robust patterning.IET Syst Biol. 2013 Apr;7(2):38-49. doi: 10.1049/iet-syb.2012.0042. IET Syst Biol. 2013. PMID: 23847812 Free PMC article. Review.
-
Noise-resistant developmental reproducibility in vertebrate somite formation.PLoS Comput Biol. 2019 Feb 4;15(2):e1006579. doi: 10.1371/journal.pcbi.1006579. eCollection 2019 Feb. PLoS Comput Biol. 2019. PMID: 30716091 Free PMC article.
-
Modularity of the segmentation clock and morphogenesis.Elife. 2025 Apr 1;14:RP106316. doi: 10.7554/eLife.106316. Elife. 2025. PMID: 40168062 Free PMC article.
-
From dynamic expression patterns to boundary formation in the presomitic mesoderm.PLoS Comput Biol. 2012;8(6):e1002586. doi: 10.1371/journal.pcbi.1002586. Epub 2012 Jun 28. PLoS Comput Biol. 2012. PMID: 22761566 Free PMC article.
-
Approximated gene expression trajectories for gene regulatory network inference on cell tracks.iScience. 2024 Aug 30;27(9):110840. doi: 10.1016/j.isci.2024.110840. eCollection 2024 Sep 20. iScience. 2024. PMID: 39290835 Free PMC article.
References
-
- Bessho Y, Miyoshi G, Sakata R, Kageyama R. Hes7: A bHLH-type repressor gene regulated by Notch and expressed in the presomitic mesoderm. Genes Cells. 2001;6:175–185. - PubMed
-
- Jouve C, et al. Notch signalling is required for cyclic expression of the hairy-like gene HES1 in the presomitic mesoderm. Development. 2000;127:1421–1429. - PubMed
-
- Oates AC, Ho RK. Hairy/E(spl)-related (Her) genes are central components of the segmentation oscillator and display redundancy with the Delta/Notch signaling pathway in the formation of anterior segmental boundaries in the zebrafish. Development. 2002;129:2929–2946. - PubMed
-
- Palmeirim I, Henrique D, Ish-Horowicz D, Pourquie O. Avian hairy gene expression identifies a molecular clock linked to vertebrate segmentation and somitogenesis. Cell. 1997;91:639–648. - PubMed
Publication types
MeSH terms
Substances
LinkOut - more resources
Full Text Sources
