. 2010 Mar 16;107(11):4991-5.
doi: 10.1073/pnas.0912062107. Epub 2010 Mar 1.

Strong intranucleoid interactions organize the Escherichia coli chromosome into a nucleoid filament

Affiliations

Strong intranucleoid interactions organize the Escherichia coli chromosome into a nucleoid filament

Paul A Wiggins et al. Proc Natl Acad Sci U S A. .

Abstract

The stochasticity of chromosome organization was investigated by fluorescently labeling genetic loci in live Escherichia coli cells. In spite of the common assumption that the chromosome is well modeled by an unstructured polymer, measurements of the locus distributions reveal that the E. coli chromosome is precisely organized into a nucleoid filament with a linear order. Loci in the body of the nucleoid show a precision of positioning within the cell of better than 10% of the cell length. The precision of interlocus distance of genomically-proximate loci was better than 4% of the cell length. The measured dependence of the precision of interlocus distance on genomic distance singles out intranucleoid interactions as the mechanism responsible for chromosome organization. From the magnitude of the variance, we infer the existence of an as-yet uncharacterized higher-order DNA organization in bacteria. We demonstrate that both the stochastic and average structure of the nucleoid is captured by a fluctuating elastic filament model.


Conflict of interest statement

The authors declare no conflict of interest.

Figures

Fig. 1.
Fig. 1.
Experimental schematic: The E. coli fiducial strains (IL01t, IL05, IL06) each carry two fiducial fluorescent loci (red and yellow foci) in addition to a probe locus (cyan lines). (A) A schematic map of the genomic location of the probes by strain. The three concentric rings represent the three fiducial strains. (B) The left and right arms of the E. coli chromosome are positioned on opposite sides of the nucleoid, with the origin at midcell. The terminus-proximate loci are positioned at both ends of the nucleoid, as well as in a crossing region that bridges the two poles of the nucleoid. External positioning mechanisms, which position a locus directly relative to the cell, are represented by curly springs. Internal positioning mechanisms, which position loci relative to one another, are represented by zigzag springs. (C) A typical composite image for the “IL06 I2” strain.
Fig. 4.
Fig. 4.
(A) The Fluctuating Filament Model. The nucleoid is represented by an elastic body with effective elasticity γ. The genome is condensed (from ter-left to ter-right) to form a nucleoid filament with constant linear DNA packing density η. Confinement of the nucleoid between positions X- and X+ acts to position the poles of the nucleoid. The chromosome fiber is folded to form the nucleoid filament. The packing density of the chromosome fiber is ηfiber. (B) Predicted singe-locus position distributions for three loci. The observed distributions (points and error regions) show both quantitative and qualitative agreement with the predicted distributions (solid curves). In particular, the predicted distributions reproduce the confinement-induced asymmetry for oriC-distant loci.
Fig. 2.
Fig. 2.
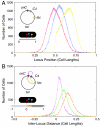
(A) Histogram of long-axis locus position for IL01t C4 cells. The genomic locus positions are shown schematically in the inset. (B) Histogram of interlocus long-axis distance between loci. The interlocus distance distributions for oriC-C4 (magenta), C4-lac (green), and lac-oriC (orange) reveal that the variance of the distribution increases with the mean distance.
Fig. 3.
Fig. 3.
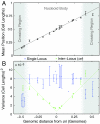
(A) The nucleoid is linearly organized. The mean long-axis position of probe loci is plotted as a function of genomic distance from oriC. (The error bars represent day-to-day variation.) (B) The precision of locus positioning. The variance, σ2, of locus position measures the precision of locus positioning. The single-locus variance (blue) is roughly constant throughout the nucleoid body (excluding the crossing region). (The error bars represent day-to-day variation.) The oriC-probe interlocus variance (green) measures the precision of probe-locus position relative to the position of oriC.

Similar articles

Cited by

References

    1. Thanbichler Martin, Viollier PH, Shapiro Lucy. The structure and function of the bacterial chromosome. Curr Opin Genet Dev. 2005;15(2):153–162. - PubMed
    1. Reyes-Lamothe Rodrigo, Wang Xindan, Sherratt David. Escherichia coli and its chromosome. Trends Microbiol. 2008;16(5):238–245. - PubMed
    1. Dekker Job. Gene regulation in the third dimension. Science. 2008;319(5871):1793–1794. - PMC - PubMed
    1. Yamaichi Yoshiharu, Niki Hironori. migS, a cis-acting site that affects bipolar positioning of oriC on the Escherichia coli chromosome. EMBO J. 2004;23(1):221–233. - PMC - PubMed
    1. Toro Esteban, Hong Sun-Hae, McAdams HH, Shapiro Lucy. Caulobacter requires a dedicated mechanism to initiate chromosome segregation. Proc Natl Acad Sci USA. 2008;105(40):15435–15440. - PMC - PubMed

Publication types

MeSH terms

LinkOut - more resources