

Picomole-scale characterization of protein stability and function by quantitative cysteine reactivity
- PMID: 20194783
- PMCID: PMC2841886
- DOI: 10.1073/pnas.0910421107
Picomole-scale characterization of protein stability and function by quantitative cysteine reactivity
Abstract
The Gibbs free energy difference between native and unfolded states ("stability") is one of the fundamental characteristics of a protein. By exploiting the thermodynamic linkage between ligand binding and stability, interactions of a protein with small molecules, nucleic acids, or other proteins can be detected and quantified. Determination of protein stability can therefore provide a universal monitor of biochemical function. Yet, the use of stability measurements as a functional probe is underutilized, because such experiments traditionally require large amounts of protein and special instrumentation. Here we present the quantitative cysteine reactivity (QCR) technique to determine protein stabilities rapidly and accurately using only picomole quantities of material and readily accessible laboratory equipment. We demonstrate that QCR-derived stabilities can be used to measure ligand binding over a wide range of ligand concentrations and affinities. We anticipate that this technique will have broad applications in high-throughput protein engineering experiments and functional genomics.
Conflict of interest statement
The authors declare no conflict of interest.
Figures
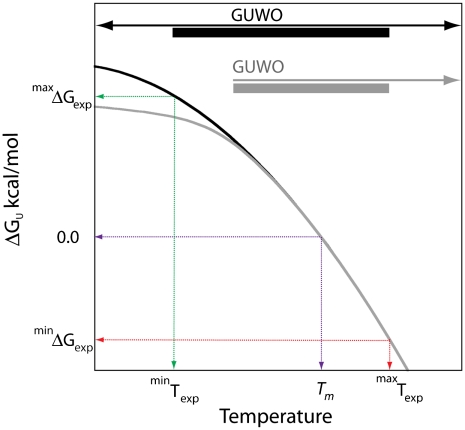
 ) and free energy (minΔGexp) at ∼10 °C above Tm (red-dashed arrows) where the difference of klabel and kint is within experimental error; a lower limit occurs at a temperature (
 ) and free energy (maxΔGexp) at ∼10–20 °C below Tm (green-dashed arrows) where increased stability sufficiently reduces klabel (Eqs. 3 and 4) such that it appears to be independent of temperature within experimental error. The second limit is set in some cases where the mechanism of cysteine protection (i.e. local or global unfolding) is dependent on temperature. Such cases manifest themselves as a deviation of the observed temperature dependence of ΔGU from that expected for global unfolding. It is well established that global unfolding conditions prevail within ∼10–20 °C of Tm (16, 17), which we refer to as the global unfolding window of observation. The black line illustrates a case in which there is no such switch (modeled by Eq. 5) and the GUWO extends over the entire temperature range; the gray line represents switching between global and local unfolding with a concomitant temperature limit for the GUWO (modeled by Eq. 12 of ref. 6). The third limit is set at a point where EX1 conditions prevail and kclose no longer exceeds kint (not illustrated). This may occur as stability is diminished (ΔGU < 1 kcal/mol) or if the concentration of thiol probe [P] is too high. Loss of EX2 conditions is manifested as a loss of the linear dependence of klabel on [P] and can be remedied by reducing [P]. The overall temperature range at which observations can be made is the intersection of all three of these conditions (black and gray bars).
Similar articles
-
A miniaturized technique for assessing protein thermodynamics and function using fast determination of quantitative cysteine reactivity.Proteins. 2011 Apr;79(4):1034-47. doi: 10.1002/prot.22932. Epub 2011 Jan 5. Proteins. 2011. PMID: 21387407 Free PMC article.
-
Thermodynamic analysis of ligand-induced changes in protein thermal unfolding applied to high-throughput determination of ligand affinities with extrinsic fluorescent dyes.Biochemistry. 2010 Dec 28;49(51):10831-41. doi: 10.1021/bi101414z. Epub 2010 Dec 3. Biochemistry. 2010. PMID: 21050007
-
Mapping staphylococcal nuclease conformation using an EDTA-Fe derivative attached to genetically engineered cysteine residues.Biochemistry. 1994 Nov 22;33(46):13625-41. doi: 10.1021/bi00250a013. Biochemistry. 1994. PMID: 7947771
-
Energetics-based methods for protein folding and stability measurements.Annu Rev Anal Chem (Palo Alto Calif). 2014;7:209-28. doi: 10.1146/annurev-anchem-071213-020024. Epub 2014 May 28. Annu Rev Anal Chem (Palo Alto Calif). 2014. PMID: 24896313 Review.
-
Protein Folding Mediated by Trigger Factor and Hsp70: New Insights from Single-Molecule Approaches.J Mol Biol. 2018 Feb 16;430(4):438-449. doi: 10.1016/j.jmb.2017.09.004. Epub 2017 Sep 11. J Mol Biol. 2018. PMID: 28911846 Review.
Cited by
-
Quantitation of protein-protein interactions by thermal stability shift analysis.Protein Sci. 2011 Aug;20(8):1439-50. doi: 10.1002/pro.674. Epub 2011 Jul 11. Protein Sci. 2011. PMID: 21674662 Free PMC article.
-
PON-tstab: Protein Variant Stability Predictor. Importance of Training Data Quality.Int J Mol Sci. 2018 Mar 28;19(4):1009. doi: 10.3390/ijms19041009. Int J Mol Sci. 2018. PMID: 29597263 Free PMC article.
-
The Potential of a Protein Model Synthesized Absent of Methionine.Molecules. 2022 Jun 8;27(12):3679. doi: 10.3390/molecules27123679. Molecules. 2022. PMID: 35744804 Free PMC article. Review.
-
Visualization of synaptic inhibition with an optogenetic sensor developed by cell-free protein engineering automation.J Neurosci. 2013 Oct 9;33(41):16297-309. doi: 10.1523/JNEUROSCI.4616-11.2013. J Neurosci. 2013. PMID: 24107961 Free PMC article.
-
Functional reconstitution of an atypical G protein heterotrimer and regulator of G protein signaling protein (RGS1) from Arabidopsis thaliana.J Biol Chem. 2011 Apr 15;286(15):13143-50. doi: 10.1074/jbc.M110.190355. Epub 2011 Feb 16. J Biol Chem. 2011. PMID: 21325279 Free PMC article.
References
-
- Wyman J. Linked functions and reciprocal effects in hemoglobin: A second look. Adv Protein Chem. 1964;19:223–286. - PubMed
-
- Schellman JA. Macromolecular Binding. Biopolymers. 1975;14(5):999–1018.
-
- Wyman J, Gill SJ. Binding and Linkage. Mill Valley, CA: University Science Books; 1990. p. 330.
-
- Huyghues-Despointes B, Pace CN, Englander SW, Scholtz JM. Protein Structure, Stability, and Folding. Totowa, NJ: Humana Press Inc; 2001.
-
- Hvidt A, Neilson SO. Hydrogen exchange in proteins. Adv Protein Chem. 1966;21:287–386. - PubMed
Publication types
MeSH terms
Substances
Grants and funding
LinkOut - more resources
Full Text Sources
Molecular Biology Databases
