The genomics education partnership: successful integration of research into laboratory classes at a diverse group of undergraduate institutions

Christopher D Shaffer et al. CBE Life Sci Educ. 2010 Spring.

Abstract

Genomics is not only essential for students to understand biology but also provides unprecedented opportunities for undergraduate research. The goal of the Genomics Education Partnership (GEP), a collaboration between a growing number of colleges and universities around the country and the Department of Biology and Genome Center of Washington University in St. Louis, is to provide such research opportunities. Using a versatile curriculum that has been adapted to many different class settings, GEP undergraduates undertake projects to bring draft-quality genomic sequence up to high quality and/or participate in the annotation of these sequences. GEP undergraduates have improved more than 2 million bases of draft genomic sequence from several species of Drosophila and have produced hundreds of gene models using evidence-based manual annotation. Students appreciate their ability to make a contribution to ongoing research, and report increased independence and a more active learning approach after participation in GEP projects. They show knowledge gains on pre- and postcourse quizzes about genes and genomes and in bioinformatic analysis. Participating faculty also report professional gains, increased access to genomics-related technology, and an overall positive experience. We have found that using a genomics research project as the core of a laboratory course is rewarding for both faculty and students.


Figures

Figure 1.
Figure 1.
Members of the GEP are located on a map of the United States, color coded by the year they joined. Red, joined in 2006; blue, joined in 2007; green, joined in 2008; and yellow, joined in 2009. For current membership, see http://gep.wustl.edu.
Figure 2.
Figure 2.
The GEP pipeline. Public whole-genome shotgun assemblies for the genomic regions of interest are split into numerous small “student-sized” projects. In most cases, draft assemblies of the projects are first finished to high-quality (see Materials and Methods for finishing standards). Draft sequences of high quality are given directly to students for annotation. All projects are analyzed by at least two students and then checked for discrepancies between student versions. Finally, the validated projects are reassembled into a single high-quality annotated genomic region for analysis and publication. D. virilis adult fly and a preparation of larval salivary gland polytene chromosomes from D. melanogaster are shown in the background.
Figure 3.
Figure 3.
Example of a student annotation of a gene. (A) Student-generated gene model (orange) compared with models from various ab initio gene prediction algorithms. Note the first two exons (top left) of the manually generated model, not found in any of the ab initio predictions. (B) Alignment of the amino acids of the first two exons of the gene model from D. melanogaster and the student model from D. erecta.
Figure 4.
Figure 4.
Current status for the dot chromosome of D. erecta. The top line indicates the status for that section of the chromosome: green, regions that have been submitted back to the GEP at least twice; brown, submitted once; and red, no submissions. Individual clones showing the “golden path” across the region are also color-coded using the same scheme.
Figure 5.
Figure 5.
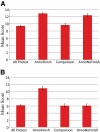
Student quiz score results. The mean quiz score results show a significant increase in average test scores for GEP students who participated in the relevant project. The left column shows the average precourse score for all groups. The AnnoFinish group is made up of those students who participated in both an annotation-based project and a finishing-based project. The comparison group was the group of non-GEP students recruited at GEP-member schools (see text). The AnnoNoFinish group is made up of those students who participated in an annotation-based project but not a finishing-based project. (A) Annotation quiz (genes and genomes). (B) Finishing quiz (sequencing reactions and data analysis). Error bars represent 2 SEs above and below the mean.
Figure 6.
Figure 6.
Student ratings of various GEP activities. Plotted are one sample confidence intervals (n = 77) for 18 items. Students rated each activity to indicate how much it contributed to their learning experience based on a 1 (little learning) to 5 (very beneficial) scale. The “Defending my conclusions” was asked once at the end of the annotation questions (1) and again at the end of the finishing questions (2).
Figure 7.
Figure 7.
Mean quiz score separated by self-reported gains. Groups of students were separated based on how much benefit they reported from “Annotating my gene/fosmid” on a 1 (little learning) to 5 (very beneficial) scale. The mean annotation quiz score is reported for each group. The overall analysis of these groups reveals significant differences (p < 0.05). The error bars represent 2 SEs above and below the mean.
Figure 8.
Figure 8.
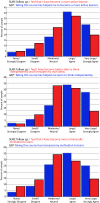
Student-reported gains comparing a summer research experience (SURE) with a GEP academic year course (GEP). These graphs show the cumulative percentages of GEP and SURE respondents from both the 2007–2008 and 2008–2009 academic years. The students in each survey were responding to slightly different statements, shown in each chart. (Top) Thinking independently. (Middle) Motivation to learn. (Bottom) Active learner. The SURE statement is shown in red and the GEP statement is shown in blue.
Figure 9.
Figure 9.
Impact on student plans. Each student was asked about his/her plans to pursue postbaccalaureate education. Percentages of respondents for each category are shown. These are the averages for the 2007–2008 and 2008–2009 GEP student surveys.
Figure 10.
Figure 10.
Faculty survey results on the impact of GEP participation. Faculty responded on a 1 (strongly disagree) to 5 (agree) scale to various statements. Mean and 1 SD are shown.

Similar articles

Cited by

References

    1. Bauer K. W., Bennett J. S. Alumni perceptions used to assess undergraduate research experience. J. High. Educ. 2003;2:210–230.
    1. Campbell A. M., Eckdahl T. T., Fowlks E., Heyer L. J., Hoopes L.L.M., Ledbetter M. L., Rosenwald A. G. Genome Consortium for Active Teaching (GCAT) Science. 2006;311:1103–1104. - PubMed
    1. Campbell A. M., Ledbetter M. L., Hoopes L. L., Eckdahl T. T., Heyer L. J., Rosenwald A., Fowlks E., Tonidandel S., Bucholtz B., Gottfried G. Genome Consortium for Active Teaching: meeting the goals of BIO2010. CBE Life Sci. Educ. 2007;2:109–118. - PMC - PubMed
    1. Clark A. G., et al. Evolution of genes and genomes on the Drosophila phylogeny. Nature. 2007;450:203–218. - PubMed
    1. Doyle M. P. Academic Excellence: The Role of Research in the Physical Sciences at Undergraduate Institutions. Tucson, AZ: Research Corporation; 2000.

Publication types

LinkOut - more resources