. 2010 Mar 16;121(10):1244-55.
doi: 10.1161/CIRCULATIONAHA.109.872481. Epub 2010 Mar 1.

Thioredoxin-1 gene therapy enhances angiogenic signaling and reduces ventricular remodeling in infarcted myocardium of diabetic rats

Affiliations

Thioredoxin-1 gene therapy enhances angiogenic signaling and reduces ventricular remodeling in infarcted myocardium of diabetic rats

Samson Mathews Samuel et al. Circulation. .

Abstract

Background: The present study evaluated the reversal of diabetes-mediated impairment of angiogenesis in a myocardial infarction model of type 1 diabetic rats by intramyocardial administration of an adenoviral vector encoding thioredoxin-1 (Ad.Trx1). Various studies have linked diabetes-mediated impairment of angiogenesis to dysfunctional antioxidant systems in which thioredoxin-1 plays a central role.

Methods and results: Ad.Trx1 was administered intramyocardially in nondiabetic and diabetic rats immediately after myocardial infarction. Ad.LacZ was similarly administered to the respective control groups. The hearts were excised for molecular and immunohistochemical analysis at predetermined time points. Myocardial function was measured by echocardiography 30 days after the intervention. The Ad.Trx1-administered group exhibited reduced fibrosis, oxidative stress, and cardiomyocyte and endothelial cell apoptosis compared with the diabetic myocardial infarction group, along with increased capillary and arteriolar density. Western blot and immunohistochemical analysis demonstrated myocardial overexpression of thioredoxin-1, heme oxygenase-1, vascular endothelial growth factor, and p38 mitogen-activated protein kinase-beta, as well as decreased phosphorylated JNK and p38 mitogen-activated protein kinase-alpha, in the Ad.Trx1-treated diabetic group. Conversely, we observed a significant reduction in the expression of vascular endothelial growth factor in nondiabetic and diabetic animals treated with tin protoporphyrin (SnPP, a heme oxygenase-1 enzyme inhibitor), even after Ad.Trx1 therapy. Echocardiographic analysis after 4 weeks of myocardial infarction revealed significant improvement in myocardial functional parameters such as ejection fraction, fractional shortening, and E/A ratio in the Ad.Trx1-administered group compared with the diabetic myocardial infarction group.

Conclusions: This study demonstrates for the first time that impairment of angiogenesis and myocardial dysfunction can be regulated by Ad.Trx1 gene therapy in streptozotocin-induced diabetic rats subjected to infarction.


Figures
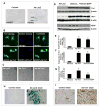
Figure 1
Figure 1
(A) Representative micrographs showing the in vitro transfection efficiency of Ad.LacZ in HUVECs. (B) Representative micrographs showing the in vitro transfection efficiency of Ad.Trx1 in HUVECs. (C) Representative micrographs showing the angiogenic potential of overexpressing Trx1 in HUVECs by in vitro Matrigel Assay. The tuburogenesis was significantly abolished by using Ad-sh-Trx1. (D) Representative Western Blots showing the effect of Ad.Trx1 transfection in HUVECs on Trx1, HO-1 and VEGF. The use of SnPP significantly reduced the expression of VEGF. Bar graphs (E), (F) and (G) represent the quantitative difference in expression of the Trx1, HO-1 and VEGF, respectively between the groups. Values are represented as mean ± SEM (n=3/group), *p≤0.05 when compared to the Ad.LacZ treated HUVEC controls and #p≤0.05 when compared to Ad.Trx1 treated HUVECs. Micrographs (H) and (I) represents the in vivo transfection efficiency of Ad.LacZ and Ad.Trx1 in the non-diabetic Sham operated groups. Scale bar = 50μm.
Figure 2
Figure 2
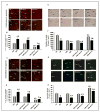
Effect of Trx1 gene therapy on: - (A and B) Myocardial fibrosis (by Masson’s trichrome staining). Representative images show myocardial fibrosis (A) 4 days after and (B) 30 days after MI and intervention. A thinner infarct and significant fibrosis is evident in the DMI and DMI-AdLacZ groups compared to the CMI and CMI-AdLacZ groups, respectively. Trx1 gene therapy in the CMI-AdTrx1 and DMI-AdTrx1 groups resulted in a thicker infarct containing islands of viable cardiac tissue with evidently lesser scar extension. (C) Oxidative stress (by DHE staining for O2·− production), representative images show DHE stained myocardial sections from the different groups 4 days after MI and intervention, Scale bar = 50μm. (D) Graph represents the quantitative analysis (arbitrary units) of the average fluorescent intensity of DHE fluorescence. Trx1 gene therapy in the DMI-AdTrx1 groups resulted in significant reduction in oxidative stress in the diabetic ischemic myocardium. The average fluorescent intensity of DHE fluorescence was calculated from 5–8 images per heart and 3–4 hearts per group. CS represents control Sham, CMI represent control group with MI, CMI-AdLacZ represents CMI rats injected with Ad.LacZ, CMI-AdTrx1 represents CMI rats injected with Ad.Trx1, DS represents diabetic Sham, DMI represent diabetic group with MI, DMI-AdLacZ represent DMI rats injected with Ad.LacZ and DMI-AdTrx1 represent DMI rats injected with Ad.Trx1. ψp≤0.05 when DS compared to CS, *p≤0.05 when compared with CMI, #p≤0.05 when compared with CMI-AdLacZ, p≤0.05 when compared with DMI and p≤0.05 when compared with DMI-AdLacZ.
Figure 3
Figure 3
Effect of Trx1 gene therapy on: - (A and B) Cardiomyocyte Apoptosis, A) Representative digital micrographs showing cardiomyocyte apoptosis in the different experimental groups, Scale bar = 20μm. B) Graph represents the quantitative analysis of cardiomyocyte apoptosis 4 days after MI in counts/100HPF. (C and D) Endothelial Cell Apoptosis C) Representative digital micrographs showing endothelial cell apoptosis in the different experimental groups, Scale bar = 20μm. D) Graph represents the quantitative analysis of endothelial cell apoptosis 4 days after MI in counts/100HPF. (E and F) Capillary Density, E) Representative digital micrographs showing capillary density/CD31 immunostaining in the different experimental groups, Scale bar = 50μm. F) Graph represents the quantitative analysis of capillary density in counts/mm2. (G and H) Arteriolar Density, G) Representative digital micrographs showing arteriolar density/α-Smooth Muscle Actin immunostaining in the different experimental groups, Scale bar = 50μm. H) Graph represents the quantitative analysis of arteriolar density in counts/mm2. Values are mean ± SEM. (n = 4/group). CS represents control Sham, CMI represent control group with MI, CMI-AdLacZ represents CMI rats treated with Ad.LacZ, CMI-AdTrx1 represents CMI rats treated with Ad.Trx1, DS represents diabetic Sham, DMI represent diabetic group with MI, DMI-AdLacZ represent DMI rats injected with Ad.LacZ and DMI-AdTrx1 represent DMI rats injected with Ad.Trx1. ψp ≤ 0.05 when DS compared to CS, *p ≤ 0.05 when compared with CMI, #p ≤ 0.05 when compared with CMI-AdLacZ, p ≤ 0.05 when compared with DMI and p ≤ 0.05 when compared with DMI-AdLacZ.
Figure 4
Figure 4
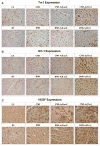
Effect of Trx1 gene therapy on A) Trx1, B) HO-1 and C) VEGF expression (immunohistochemical analysis by DAB staining) 4 days after MI and gene therapy. (n = 3–4/group). CS represents control Sham, CMI represent control group with MI, CMI-AdLacZ represents CMI rats treated with Ad.LacZ, CMI-AdTrx1 represents CMI rats treated with Ad.Trx1, DS represents diabetic Sham, DMI represent diabetic group with MI, DMI-AdLacZ represent DMI rats injected with Ad.LacZ and DMI-AdTrx1 represent DMI rats injected with Ad.Trx1. Scale bar = 50μm.
Figure 5
Figure 5
Effect of Trx1 gene therapy on Trx1, HO-1 and VEGF expression (Western blot analysis): - (A) Representative Western blots show the expression of Trx1, HO-1 and VEGF. Bar graphs (B), (C) and (D) represent the quantitative difference in expression of Trx1, HO-1 and VEGF respectively in arbitrary units. There was significant decrease in the expression of Trx1, HO-1 and VEGF in the DMI and DMI-AdlacZ compared to the CMI and CMI-AdLacZ groups, respectively. There was no significant difference in the expression of these proteins in the Ad.LacZ treated group compared to the respective non-treated MI groups. Trx1 gene therapy significantly increased the expression of Trx1, HO-1 and VEGF when compared to non-treated and Ad.LacZ treated MI groups, in both non-diabetic and diabetic myocardium. SnPP treatment significantly reduced the Trx1 gene therapy mediated increase in VEGF in both non-diabetic and diabetic myocardium, while there was no significant difference in the expression of Trx1 and HO-1 in these groups. Values are expressed as mean ± SEM. (n = 3–4/group). CMI represent control group with MI, CMI-AdLacZ represents CMI rats injected with Ad.LacZ, CMI-AdTrx1 represents CMI rats injected with Ad.Trx1, DMI represents diabetic group with MI, DMI-AdLacZ represent DMI rats injected with Ad.LacZ, DMI-AdTrx1 represent DMI rats injected with Ad.Trx1, CMI-AdTrx1 + SnPP represents the non-diabetic animals that were treated with SnPP and then subjected to MI and Ad.Trx1 treatment and DMI-AdTrx1 + SnPP represents the diabetic animals that were treated with SnPP and then subjected to MI and Ad.Trx1 treatment. *p ≤ 0.05 when compared with CMI, #p ≤ 0.05 when compared with CMI-AdLacZ, p ≤ 0.05 when compared with DMI, p ≤ 0.05 when compared with DMI-AdLacZ, p ≤ 0.05 when compared to CMI-AdTrx1 and ¥p ≤ 0.05 when compared to DMI-AdTrx1.
Figure 6
Figure 6
Effect of Trx1 gene therapy on p38MAPKα, p38MAPKβ and p-JNK expression (Western blot analysis): - (A) Representative Western blots show the expression of p38MAPKα, p38MAPKβ and p-JNK Bar graphs (B), (C) and (D) represent the quantitative difference in expression of p38MAPKα, p38MAPKβ and p-JNK, respectively. There was significant increase in the expression of pro-apoptotic p38MAPKα and p-JNK and significant decrease in the expression of anti-apoptotic p38MAPKβ in the DMI and DMI-AdLacZ groups compared to the CMI and CMI-AdLacZ groups, respectively. There was no significant difference in the expression of these proteins in the Ad.LacZ treated group compared to the respective non-treated MI groups. Trx1 gene therapy significantly increased the expression of p38MAPKβ while decreasing the expression of p38MAPKα and p-JNK when compared to non-treated and Ad.LacZ treated MI groups, in both non-diabetic and diabetic myocardium. Values are mean ± SEM. (n = 3–4/group) CMI represent control group with MI, CMI-AdLacZ represents CMI rats injected with Ad.LacZ, CMI-AdTrx1 represents CMI rats injected with Ad.Trx1, DMI represents diabetic group with MI, DMI-AdLacZ represent DMI rats injected with Ad.LacZ and DMI-AdTrx1 represent DMI rats injected with Ad.Trx1. *p ≤0.05 when compared with CMI, #p ≤ 0.05 when compared with CMI-AdLacZ, p ≤0.05 when compared with DMI and p ≤ 0.05 when compared with DMI-AdLacZ.
Figure 7
Figure 7
Effect of Trx1 gene therapy on left ventricular myocardial functions (echocardiography). (A) Representative echocardiograph pictures of parasternal short axis images, 30 days after MI and gene therapy. Bar graphs represent: - (B) Left Ventricular Inner Diameter in systole (LVIDs, in mm); (C) Left Ventricular Inner Diameter in diastole (LVIDd, in mm); (D) E/A ratio; (E) Ejection Fraction (EF in %) and (F) Fractional Shortening (FS in %). There was significant diastolic (as evidenced by increased E/A ratio) and systolic (as evidenced by reduced EF and FS) functional disorder in the DMI and DMI-AdLacZ groups compared to the CMI and CMI-AdLacZ groups, respectively. There was no significant difference in the myocardial functions in the Ad.LacZ treated group compared to the respective non-treated MI groups. Trx1 gene therapy significantly improved both diastsolic and systolic functional parameters when compared to non-treated and Ad.LacZ treated MI groups, in both non-diabetic and diabetic myocardium. Values are mean ± SEM. (n = 4–5/group). CS represents control Sham, CMI represent control group with MI, CMI-AdLacZ represents CMI rats injected with Ad.LacZ, CMI-AdTrx1 represents CMI rats injected with Ad.Trx1, DS represents diabetic Sham, DMI represent diabetic group with MI, DMI-AdLacZ represent DMI rats injected with Ad.LacZ and DMI-AdTrx1 represent DMI rats injected with Ad.Trx1. ψp ≤ 0.05 when DS compared to CS, *p ≤ 0.05 when compared with CMI, #p ≤ 0.05 when compared with CMI-AdLacZ, p ≤ 0.05 when compared with DMI and p ≤ 0.05 when compared with DMI-AdLacZ.

Similar articles

Cited by

References

    1. Barzilay JI, Kronmal RA, Bittner V, Eaker E, Evans C, Foster ED. Coronary artery disease and coronary artery bypass grafting in diabetic patients aged > or = 65 years (report from the Coronary Artery Surgery Study [CASS] Registry) Am J Cardiol. 1994;74:334–339. - PubMed
    1. Martin A, Komada MR, Sane DC. Abnormal angiogenesis in diabetes mellitus. Med Res Rev. 2003;23:117–145. - PubMed
    1. Wiernsperger NF. Oxidative stress as a therapeutic target in diabetes: revisiting the controversy. Diabetes Metab. 2003;29:579–585. - PubMed
    1. Di Filippo C, Cuzzocrea S, Rossi F, Marfella R, D’Amico M. Oxidative stress as the leading cause of acute myocardial infarction in diabetics. Cardiovasc Drug Rev. 2006;24:77–87. - PubMed
    1. Nordberg J, Arner ES. Reactive oxygen species, antioxidants, and the mammalian thioredoxin system. Free Radic Biol Med. 2001;31:1287–1312. - PubMed

Publication types

MeSH terms

Substances