. 2010 Mar 17;102(6):426-42.
doi: 10.1093/jnci/djq026. Epub 2010 Mar 1.

Roles of arrest-defective protein 1(225) and hypoxia-inducible factor 1alpha in tumor growth and metastasis

Affiliations

Roles of arrest-defective protein 1(225) and hypoxia-inducible factor 1alpha in tumor growth and metastasis

Mi-Ni Lee et al. J Natl Cancer Inst. .

Abstract

Background: Vascular endothelial growth factor A (VEGFA), a critical mediator of tumor angiogenesis, is a well-characterized target of hypoxia-inducible factor 1 (HIF-1). Murine arrest-defective protein 1A (mARD1A(225)) acetylates HIF-1alpha, triggering its degradation, and thus may play a role in decreased expression of VEGFA.

Methods: We generated Apc(Min/+)/mARD1A(225) transgenic mice and quantified growth of intestinal polyps. Human gastric MKN74 and murine melanoma B16F10 cells overexpressing mARD1A(225) were injected into mice, and tumor growth and metastasis were measured. VEGFA expression and microvessel density in tumors were assessed using immunohistochemistry. To evaluate the role of mARD1A(225) acetylation of Lys532 in HIF-1alpha, we injected B16F10-mARD1A(225) cell lines stably expressing mutant HIF-1alpha/K532R into mice and measured metastasis. All statistical tests were two-sided, and P values less than .05 were considered statistically significant.

Results: Apc(Min/+)/mARD1A(225) transgenic mice (n = 25) had statistically significantly fewer intestinal polyps than Apc(Min/+) mice (n = 21) (number of intestinal polyps per mouse: Apc(Min/+) mice vs Apc(Min/+)/mARD1A(225) transgenic mice, mean = 83.4 vs 38.0 polyps, difference = 45.4 polyps, 95% confidence interval [CI] = 41.8 to 48.6; P < .001). The growth and metastases of transplanted tumors were also statistically significantly reduced in mice injected with mARD1A(225)-overexpressing cells than in mice injected with control cells (P < .01). Moreover, overexpression of mARD1A(225) decreased VEGFA expression and microvessel density in tumor xenografts (P < .04) and Apc(Min/+) intestinal polyps (P = .001). Mutation of lysine 532 of HIF-1alpha in B16F10-mARD1A(225) cells prevented HIF-1alpha degradation and inhibited the antimetastatic effect of mARD1A(225) (P < .001).

Conclusion: mARD1A(225) may be a novel upstream target that blocks VEGFA expression and tumor-related angiogenesis.


Figures
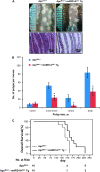
Figure 1
Figure 1
Effect of transgenic overexpression of mARD1A225 on intestinal tumorigenesis in ApcMin/+ mice. A) Representative images (top) and hematoxylin and eosin staining (bottom) of small intestinal polyps from 16-week-old ApcMin/+ mice and ApcMin/+/mARD1A225 transgenic mice (Tg). Magnification ×100. Scale bar = 200 μm. B) Tumor size distribution of polyps in the small intestine from ApcMin/+ mice (n = 21 per group) and ApcMin/+/mARD1A225 Tg (n = 25 per group). Polyps were classified according to size in millimeters. Results are means with 95% confidence intervals (error bars). *P < .001, compared with ApcMin/+ mice, determined with the two-sided Mann–Whitney U test. C) Kaplan–Meier survival plot of ApcMin/+ (mean = 141 days, 95% confidence interval = 131 to 151, n = 10 per group, solid line) and ApcMin/+/mARD1A225 Tg (mean = 170 days, 95% confidence interval = 150 to 191, n = 10 per group, dotted line). *P = .005, compared with ApcMin/+ mice, determined with log-rank tests. All statistical tests were two-sided.
Figure 2
Figure 2
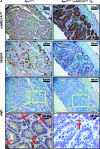
Effect of transgenic overexpression of mARD1A225 on neovascularization and vascular endothelial growth factor A (VEGFA) expression in intestinal polyps in ApcMin/+/mARD1A225 transgenic mice. A) Immunohistochemical analysis of mARD1A225 (top row), VEGFA (second row), and von Willebrand Factor (vWF, third row) in intestinal polyps of ApcMin/+ mice and ApcMin/+/mARD1A225 transgenic mice at 16 weeks of age (n = 8 mice per group). Magnification ×200. Scale bars = 100 μm. Higher magnification of the selected area (third row, yellow boxes) on vWF with vessels indicated by red arrows within the polyps (bottom row). Magnification ×400. Scale bar = 20 μm. B) The numbers of VEGFA-positive cells in polyps are presented as means with 95% confidence intervals (error bars). VEGFA-positive cells in four high-power fields (×200) from each of the eight mice per group were scored for quantification. *P = .001, compared with the number of VEGFA-positive cells in ApcMin/+ mouse intestinal polyps, as determined with the two-sided Mann–Whitney U test. C) Concentrations of mouse VEGFA protein in serum from ApcMin/+ mice and ApcMin/+/mARD1A225 transgenic mice, respectively (n = 12 mice per group). VEGFA protein levels were quantified by enzyme-linked immunosorbent assay (ELISA). The experiment was performed in two replicate for each of 12 mice per group. The levels of VEGFA protein in serum are presented as means and 95% confidence intervals (error bars) that are derived from the means of the individual mice (n = 12). *P = .023, compared with the levels of VEGFA protein in ApcMin/+ mouse serum, as determined with the two-sided Mann–Whitney U test. D) The numbers of vWF-positive vessels in polyps are presented as means and 95% confidence intervals (error bars). Vessels from five high-power fields (×400) from each of the eight mice per group were scored for quantification. *P = .001, compared with the number of vWF-positive vessels in ApcMin/+ mouse intestinal polyps, as determined with the two-sided Mann–Whitney U test. Tg = transgenic mice.
Figure 2
Figure 2
Effect of transgenic overexpression of mARD1A225 on neovascularization and vascular endothelial growth factor A (VEGFA) expression in intestinal polyps in ApcMin/+/mARD1A225 transgenic mice. A) Immunohistochemical analysis of mARD1A225 (top row), VEGFA (second row), and von Willebrand Factor (vWF, third row) in intestinal polyps of ApcMin/+ mice and ApcMin/+/mARD1A225 transgenic mice at 16 weeks of age (n = 8 mice per group). Magnification ×200. Scale bars = 100 μm. Higher magnification of the selected area (third row, yellow boxes) on vWF with vessels indicated by red arrows within the polyps (bottom row). Magnification ×400. Scale bar = 20 μm. B) The numbers of VEGFA-positive cells in polyps are presented as means with 95% confidence intervals (error bars). VEGFA-positive cells in four high-power fields (×200) from each of the eight mice per group were scored for quantification. *P = .001, compared with the number of VEGFA-positive cells in ApcMin/+ mouse intestinal polyps, as determined with the two-sided Mann–Whitney U test. C) Concentrations of mouse VEGFA protein in serum from ApcMin/+ mice and ApcMin/+/mARD1A225 transgenic mice, respectively (n = 12 mice per group). VEGFA protein levels were quantified by enzyme-linked immunosorbent assay (ELISA). The experiment was performed in two replicate for each of 12 mice per group. The levels of VEGFA protein in serum are presented as means and 95% confidence intervals (error bars) that are derived from the means of the individual mice (n = 12). *P = .023, compared with the levels of VEGFA protein in ApcMin/+ mouse serum, as determined with the two-sided Mann–Whitney U test. D) The numbers of vWF-positive vessels in polyps are presented as means and 95% confidence intervals (error bars). Vessels from five high-power fields (×400) from each of the eight mice per group were scored for quantification. *P = .001, compared with the number of vWF-positive vessels in ApcMin/+ mouse intestinal polyps, as determined with the two-sided Mann–Whitney U test. Tg = transgenic mice.
Figure 3
Figure 3
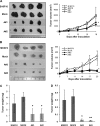
Effect of mARD1A225 on primary tumor growth in mice. A) Representative images of primary tumor masses (left panel) and growth curves (right panel) are shown. C57BL/6 mice were injected subcutaneously with B16F10 (open diamond), B16F10-mock (open square), or B16F10-mARD1A225 cells (two clones; closed symbols). Results are means and 95% confidence intervals (error bars). *P = .003, **P < .001, compared with mock control cells, as determined with two-way repeated measures analysis of variance (ANOVA). B) Representative images of primary tumor masses (left panel) and growth curves (right panel) are shown. Nude mice were injected subcutaneously with MKN74 (open diamond), MKN74-mock (open square), or MKN74-mARD1A225 cells (two clones; closed symbols). Results are means and 95% confidence intervals (error bars). *P = .007, **P < .001, compared with mock control cells, as determined with two-way repeated measures ANOVA. C) Tumor weights (n = 8 per group) were measured 3 weeks after inoculation with B16F10, B16F10-mock, or B16F10-mARD1A225 cells. Results are means and 95% confidence intervals (error bars). *P = .021, compared with mock control cells, as determined with the two-sided Mann–Whitney U test. D) Tumor weights (n = 10 per group) were measured 3 weeks after inoculation with MKN74, MKN74-mock, and MKN74-mARD1A225 cells. Results are means and 95% confidence intervals (error bars). *P = .017, **P = .015, compared with mock control cells, as determined with the two-sided Mann–Whitney U test. A#1= B16F10-mARD1A225 #1; A#2 = B16F10-mARD1A225 #2; A#3 = MKN74-mARD1A225 #3; A#4 = MKN74-mARD1A225 #4.
Figure 4
Figure 4
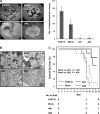
Effect of mARD1A225 on lung nodule formation in mice. A and B) C57BL/6 mice were injected intravenously with B16F10, B16F10-mock, or B16F10-mARD1A225 cells. The incidence of lung nodules was determined 19 days after injection (n = 8 per group). A) Representative images of lungs (left). Numbers of surface tumor nodules (right). Results are means and 95% confidence intervals (CIs) (error bars) of two independent experiments performed with four mice per group. *P = .006, compared with the number of surface tumor nodules detected in B16F10-mock–injected mice, as determined with the two-sided Mann–Whitney U test. B) Hematoxylin and eosin staining of 4-μm lung tissue sections excised from mice described in (A). Magnification ×50. Scale bar = 500 μm. C) Kaplan–Meier survival plot of C57BL/6 mice injected with B16F10 (mean = 16.7 days, 95% CI = 15.7 to 17.7), B16F10-mock (mean = 18 days, 95% CI = 15.5 to 20.5), or B16F10-mARD1A225 cells (A#1, mean = 23.9 days, 95% CI = 22.5 to 25.3; A#2, mean = 22.7 days, 95% CI = 20.8 to 24.5) (n = 9 per group). Comparisons were made with log-rank tests. All statistical tests were two-sided.
Figure 5
Figure 5
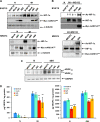
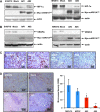
Effect of mARD1A225 on VEGFA expression. A) B16F10, B16F10-mock, and B16F10-mARD1A225 cells were exposed to 1% O2 (4H) or 21% O2 (N) for 4 hours (top). MKN74-mock and MKN74-mARD1A225 cells were exposed to 1% O2 (4H) or 21% O2 (N) for 4 hours (bottom). HIF-1α and mARD1A225 protein levels were examined by Western blot analysis. Anti-Myc antibody was used for the detection of mARD1A225. B) B16F10, B16F10-mock, and B16F10-mARD1A225 cells were exposed to 21% O2 (N) or 10 μM MG132 and 1% O2 for 6 hours (6H + MG132) (top). MKN74, MKN74-mock, and MKN74-mARD1A225 cells were exposed to 21% O2 (N) (not shown) or 10 μM MG132 and 1% O2 for 4 hours (4H + MG132) (bottom). Cell lysates were immunoprecipitated with an anti–acetyl lysine antibody and subjected to Western blot analysis with an anti-HIF-1α antibody. The level of mARD1A225 was determined using an anti-Myc antibody. C) MKN74, MKN74-mock, and MKN74-mARD1A225 cells were exposed to 1% O2 (48H) or 21% O2 (N) for 48 hours. Reverse transcription–polymerase chain reaction analysis was performed to detect gene expression using specific primers for VEGFA and glyceraldehyde 3-phosphate dehydrogenase. D) VEGFA protein levels were quantified in conditioned media from control and mARD1A225-expressing cells treated with CoCl2 using enzyme-linked immunosorbent assay ELISA. B16F10, B16F10-mock, and B16F10-mARD1A225 cells were cultured in the absence (N) or presence of 200 μM CoCl2 for 4 hours (4H) (left). MKN74, MKN74-mock, and MKN74-mARD1A225 cells were cultured in the absence (N) or presence of 200 μM CoCl2 for 48 hours (48H) (right). Three independent experiments were performed, each in two replicates. Results are means and 95% confidence intervals (error bars) derived from the means of individual experiments (n = 3). *P = .046, **P = .05, ***P = .021, compared with mock control cells, determined with the two-sided Mann–Whitney U test.
Figure 6
Figure 6
Effect of VEGFA treatment or HIF-1α/K532R overexpression on tube formation, migration, and invasion by mARD1A225. A) Human umbilical vein endothelial cells (HUVECs) were incubated for 6 hours on Matrigel with hypoxic-conditioned media from MKN74, MKN74-mock, and MKN74-mARD1A225 (A#3 and A#4) cells (top left) and MKN74-mARD1A225 cells treated with 10 ng/mL recombinant human VEGFA protein (A#3+VEGFA and A#4+VEGFA), and MKN74-mARD1A225 cells transfected with HIF-1α/K532R (A#3+K532R and A#4+K532R) (bottom left). Scale bar = 200 μm. Quantification of tube formation (right). Results are mean of three replicates from one experiment and their 95% confidence intervals (error bars) (n = 3). *P = .05, compared with the number of MKN74-mock cells; #P = .05, compared with the number of MKN74-mARD1A225 #3 or #4 cells, as determined with the two-sided Mann–Whitney U test. B) (Left) HUVECs and conditioned media were added to transwells, and migrating cells were counted. Data are averaged over three independent experiments. Scale bar = 100 μm. Quantification of migration (right). Results are mean of three replicates from one experiment and their 95% confidence intervals (error bars) (n = 3). *P = .05, compared with the number of MKN74-mock cells; #P = .05, compared with the number of MKN74-mARD1A225 #3 or #4 cells, as determined with the two-sided Mann–Whitney U test. C) Transwells were coated with Matrigel. Cells were stained with hematoxylin and eosin. Representative microscopic images illustrate HUVEC invasion (left). Scale bar = 100 μm. Quantification of invasion (right). Results are mean of three replicates from one experiment and their 95% confidence intervals (error bars) (n = 3). *P = .05, compared with the number of MKN74-mock cells; #P = .05, compared with the number of MKN74-mARD1A225 #3 or #4 cells, as determined with the two-sided Mann–Whitney U test. A#3 = MKN74-mARD1A225 #3; A#4 = MKN74-mARD1A225 #4; A#3+VEGFA = MKN74-mARD1A225 #3+ recombinant human VEGFA protein; A#4+VEGFA = MKN74-mARD1A225 #4+ recombinant human VEGFA protein; A#3+K532R = MKN74-mARD1A225 #3+HIF-1α/K532R; A#4+K532R = MKN74-mARD1A225 #4+HIF-1α/K532R.
Figure 7
Figure 7
Effect of mARD1A225 on neovascularization. A) Western blot analysis of HIF-1α and mARD1A225 protein expression in transplanted B16F10 (left) and MNK74 (right) tumor cells. B) Western blot analysis of VEGFA protein expression in transplanted B16F10 (left) and MNK74 (right) tumor cells. C) BALB/cSlc-nude mice were injected subcutaneously with MKN74, MKN74-mock, or two MKN74-mARD1A225 clones, A#3 and A#4. After 3 weeks, formalin-fixed primary tumor sections from each mouse were prepared and stained with an anti-VEGFA antibody. The brown color signifies VEGFA in primary tumors. Magnification ×400. Scale bar = 50 μm. A#3 = MKN74-mARD1A225 #3; A#4 = MKN74-mARD1A225 #4. One representative image of five per cell line is shown. D) Anti-CD34 staining of xenograft tumors derived from MKN74, MKN74-mock, and MKN74-mARD1A225 cells, indicative of endothelial cells (left). Numbers of CD34-positive vessels in primary tumors (right) expressed as means and 95% confidence intervals (error bars). Vessels from four or five fields from each of the five tumors per group were scored for quantification. *P = .043, **P = .021, compared with the number of CD34-positive vessels in tumors derived from MKN74-mock cells, as determined with the two-sided Mann–Whitney U test. Magnification ×200. Scale bar = 100 μm.
Figure 8
Figure 8
Effects of lysine 532 mutation in HIF-1α. A) HIF-1α protein levels were determined by Western blot analysis. B16F10-mock, B16F10-mARD1A225, and B16F10-mARD1A225-HIF-1α/K532R cells were cultured in the absence (N) or presence of 200 μM CoCl2 for 24 hours (24H). Similar results were obtained with three independent experiments. B) VEGFA levels (in picograms per milliliter) were quantified using enzyme-linked immunosorbent assay. B16F10, B16F10-mock, B16F10-mARD1A225, and B16F10-mARD1A225-HIF-1α/K532R cells were cultured in the absence (N) or presence of 200 μM CoCl2 for 4 hours (4H). Three independent experiments were performed, each in two replicates. Results are means and 95% confidence intervals (error bars) derived from the means of the individual experiments (n = 3). *P = .05 for all comparisons as determined with the two-sided Mann–Whitney U test. C) B16F10, B16F10-mock, B16F10-mARD1A225, and B16F10-mARD1A225-HIF-1α/K532R cells were grown to 80% confluence. A linear injury line was created at the center of the cultured monolayer by scraping with a sterile pipette tip. Cells were incubated in the presence of 200 μM CoCl2 for 24 hours. B16F10, B16F10-mock, and B16F10-mARD1A225-HIF-1α/K532R cells were treated with 3 μg/mL anti-mouse VEGFA antibody. B16F10-mARD1A225 cells were treated with 25 ng/mL recombinant mouse VEGFA protein. Images of cell migration (left). Quantification of cell migration (right). Migration distance (in micrometers); P = .004, determined with the two-sided Mann–Whitney U test. Three independent experiments were performed, each in two replicates. Results are means and 95% confidence intervals (error bars) derived from the means of the individual experiments (n = 3). Magnification ×100. Scale bar = 100 μm. D) C57BL/6 mice were injected intravenously with B16F10-mock (n = 40 mice), B16F10-mARD1A225 (n = 31 mice) and B16F10-mARD1A225-HIF-1α/K532R cells (n = 11 mice). Lung nodule formation was determined 14 days after injection. Representative gross images of lungs are shown (left). Numbers of surface tumor nodules per mouse (right). Results are means and 95% confidence intervals (error bars). *P < .001, compared with the number of surface tumor nodules in B16F10-mock–injected mice, #P < .001, compared with the number of surface tumor nodules in B16F10-mARD1A225–injected mice, as determined with the two-sided Mann–Whitney U test. A#1 = B16F10-mARD1A225 #1; A#2 = B16F10-mARD1A225 #2; A#1/HIF K532R = B16F10-mARD1A225 #1-HIF-1α/K532R; B16F10 + anti-VEGFA = B16F10 + anti-mouse VEGFA antibody; Mock + anti-VEGFA = B16F10-Mock + anti-mouse VEGFA antibody; A#1/HIF K532R + anti-VEGFA = B16F10-mARD1A225 #1-HIF-1α/K532R + anti-mouse VEGFA antibody; A#1+VEGFA = B16F10-mARD1A225 #1 + recombinant mouse VEGFA protein; A#2+VEGFA = B16F10-mARD1A225 #2 + recombinant mouse VEGFA protein.
Figure 8
Figure 8
Effects of lysine 532 mutation in HIF-1α. A) HIF-1α protein levels were determined by Western blot analysis. B16F10-mock, B16F10-mARD1A225, and B16F10-mARD1A225-HIF-1α/K532R cells were cultured in the absence (N) or presence of 200 μM CoCl2 for 24 hours (24H). Similar results were obtained with three independent experiments. B) VEGFA levels (in picograms per milliliter) were quantified using enzyme-linked immunosorbent assay. B16F10, B16F10-mock, B16F10-mARD1A225, and B16F10-mARD1A225-HIF-1α/K532R cells were cultured in the absence (N) or presence of 200 μM CoCl2 for 4 hours (4H). Three independent experiments were performed, each in two replicates. Results are means and 95% confidence intervals (error bars) derived from the means of the individual experiments (n = 3). *P = .05 for all comparisons as determined with the two-sided Mann–Whitney U test. C) B16F10, B16F10-mock, B16F10-mARD1A225, and B16F10-mARD1A225-HIF-1α/K532R cells were grown to 80% confluence. A linear injury line was created at the center of the cultured monolayer by scraping with a sterile pipette tip. Cells were incubated in the presence of 200 μM CoCl2 for 24 hours. B16F10, B16F10-mock, and B16F10-mARD1A225-HIF-1α/K532R cells were treated with 3 μg/mL anti-mouse VEGFA antibody. B16F10-mARD1A225 cells were treated with 25 ng/mL recombinant mouse VEGFA protein. Images of cell migration (left). Quantification of cell migration (right). Migration distance (in micrometers); P = .004, determined with the two-sided Mann–Whitney U test. Three independent experiments were performed, each in two replicates. Results are means and 95% confidence intervals (error bars) derived from the means of the individual experiments (n = 3). Magnification ×100. Scale bar = 100 μm. D) C57BL/6 mice were injected intravenously with B16F10-mock (n = 40 mice), B16F10-mARD1A225 (n = 31 mice) and B16F10-mARD1A225-HIF-1α/K532R cells (n = 11 mice). Lung nodule formation was determined 14 days after injection. Representative gross images of lungs are shown (left). Numbers of surface tumor nodules per mouse (right). Results are means and 95% confidence intervals (error bars). *P < .001, compared with the number of surface tumor nodules in B16F10-mock–injected mice, #P < .001, compared with the number of surface tumor nodules in B16F10-mARD1A225–injected mice, as determined with the two-sided Mann–Whitney U test. A#1 = B16F10-mARD1A225 #1; A#2 = B16F10-mARD1A225 #2; A#1/HIF K532R = B16F10-mARD1A225 #1-HIF-1α/K532R; B16F10 + anti-VEGFA = B16F10 + anti-mouse VEGFA antibody; Mock + anti-VEGFA = B16F10-Mock + anti-mouse VEGFA antibody; A#1/HIF K532R + anti-VEGFA = B16F10-mARD1A225 #1-HIF-1α/K532R + anti-mouse VEGFA antibody; A#1+VEGFA = B16F10-mARD1A225 #1 + recombinant mouse VEGFA protein; A#2+VEGFA = B16F10-mARD1A225 #2 + recombinant mouse VEGFA protein.

Similar articles

Cited by

References

    1. Mullen JR, Kayne PS, Moerschell RP, et al. Identification and characterization of genes and mutants for an N-terminal acetyltransferase from yeast. EMBO J. 1989;8(7):2067–2075. - PMC - PubMed
    1. Lee FJ, Lin LW, Smith JA. N alpha acetylation is required for normal growth and mating of Saccharomyces cerevisiae. J Bacteriol. 1989;171(11):5795–5802. - PMC - PubMed
    1. Whiteway M, Freedman R, Van Arsdell S, Szostak JW, Thorner J. The yeast ARD1 gene product is required for repression of cryptic mating-type information at the HML locus. Mol Cell Biol. 1987;7(10):3713–3722. - PMC - PubMed
    1. Whiteway M, Szostak JW. The ARD1 gene of yeast functions in the switch between the mitotic cell cycle and alternative developmental pathways. Cell. 1985;43(2, pt 1):483–492. - PubMed
    1. Jeong JW, Bae MK, Ahn MY, et al. Regulation and destabilization of HIF-1alpha by ARD1-mediated acetylation. Cell. 2002;111(5):709–720. - PubMed

Publication types

MeSH terms