

doi: 10.1377/hlthaff.2009.0666.
Trends in snacking among U.S. children
Affiliations
- PMID: 20194979
- PMCID: PMC2837536
- DOI: 10.1377/hlthaff.2009.0666
Item in Clipboard
Trends in snacking among U.S. children
Health Aff (Millwood).
2010 Mar-Apr.
Abstract
Nationally representative surveys of food intake in U.S. children show large increases in snacking between the 1989-91 to 1994-98 and 1994-98 to 2003-06 periods. Childhood snacking trends are moving toward three snacks per day, and more than 27 percent of children's daily calories are coming from snacks. The largest increases have been in salty snacks and candy. Desserts and sweetened beverages remain the major sources of calories from snacks.
Figures
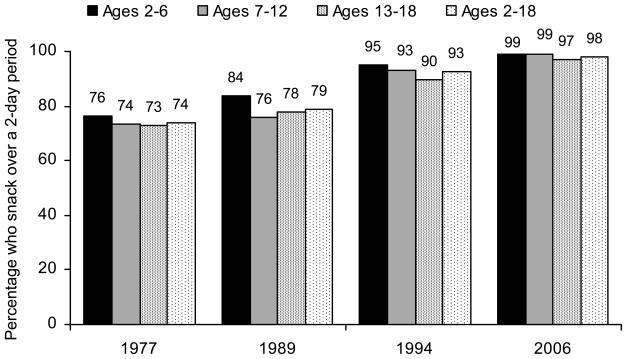
SOURCE: Content based on authors’ assessments.
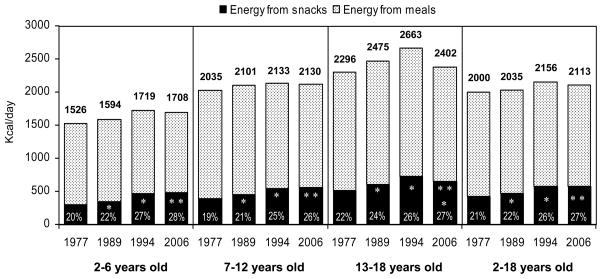
SOURCE: Content based on authors’ assessments. Notes:*Significantly different from the previous year, P<0.01 (Student’s t test). **Significantly different between 1977–78 and 2003–06, P<0.01 (Student’s t test). Standard errors for the total kcal for snacking are found in Exhibit 2.
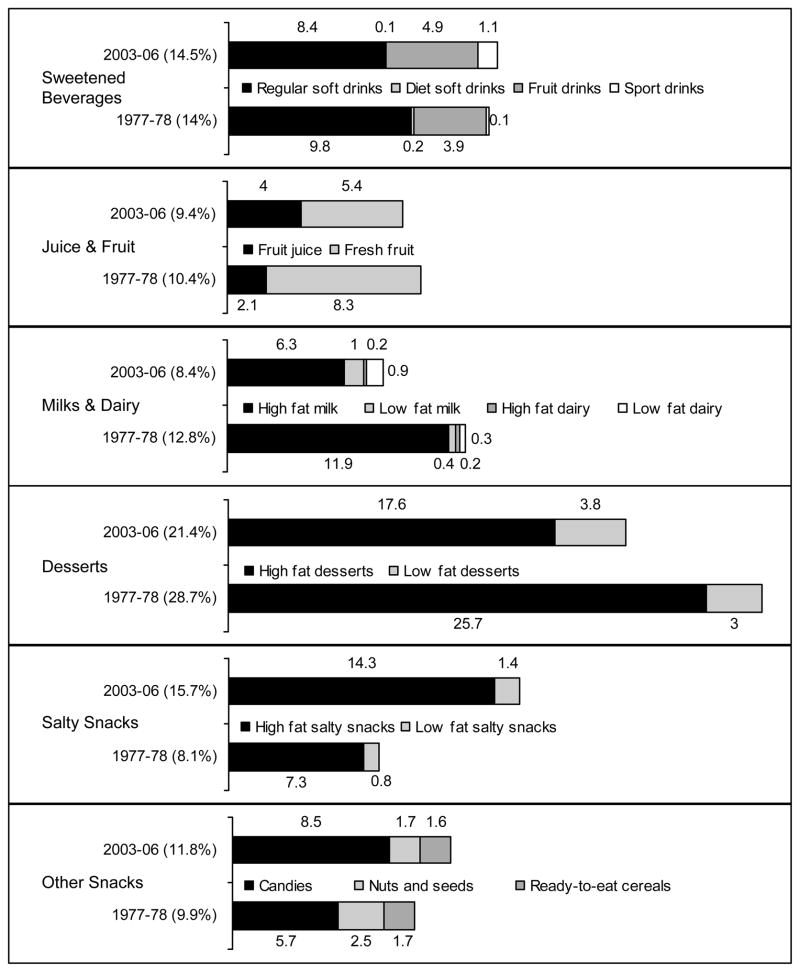
SOURCE: Content based on authors’ assessments.
References
-
- Nicklas TA, Yang SJ, Baranowski T, Zakeri I, Berenson G. Eating patterns and obesity in children. The Bogalusa Heart Study. Am J Prev Med. 2003 Jul;25(1):9–16. - PubMed
-
- Nielsen SJ, Siega-Riz AM, Popkin BM. Trends in energy intake in U.S. between 1977 and 1996: similar shifts seen across age groups. Obes Res. 2002 May;10(5):370–8. - PubMed
-
- Nicklas TA, Morales M, Linares A, Yang SJ, Baranowski T, De Moor C, et al. Children’s meal patterns have changed over a 21-year period: the Bogalusa Heart Study. J Am Diet Assoc. 2004 May;104(5):753–61. - PubMed
-
- Summerbell CD, Moody RC, Shanks J, Stock MJ, Geissler C. Relationship between feeding pattern and body mass index in 220 free-living people in four age groups. Eur J Clin Nutr. 1996 Aug;50(8):513–9. - PubMed
-
- Rocandio AM, Ansotegui L, Arroyo M. Comparison of dietary intake among overweight and non-overweight schoolchildren. Int J Obes Relat Metab Disord. 2001 Nov;25(11):1651–5. - PubMed
Publication types
MeSH terms
Grants and funding
LinkOut - more resources
Full Text Sources
Other Literature Sources
Medical