. 2010 May;90(5):709-23.
doi: 10.1038/labinvest.2010.52. Epub 2010 Mar 1.

Molecular blockade of VEGFR2 in human epithelial ovarian carcinoma cells

Affiliations

Molecular blockade of VEGFR2 in human epithelial ovarian carcinoma cells

Sirin A I Adham et al. Lab Invest. 2010 May.

Abstract

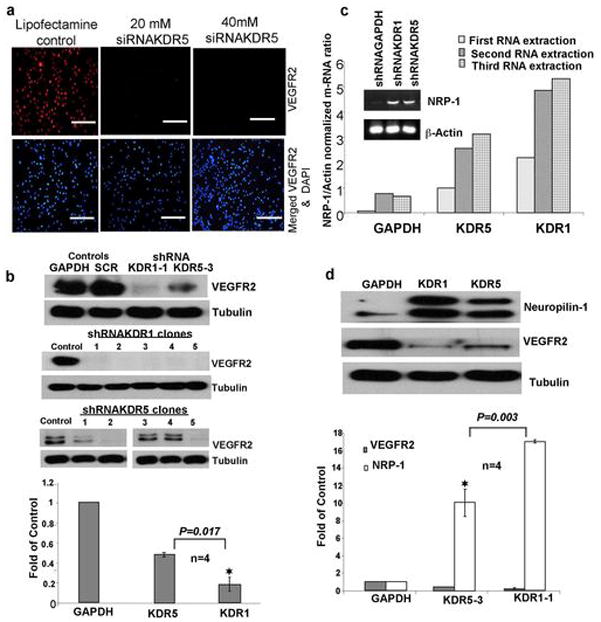
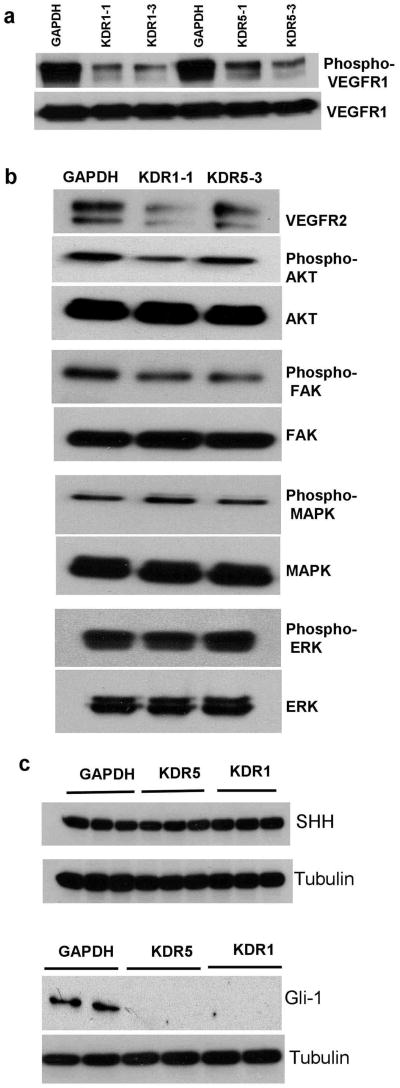
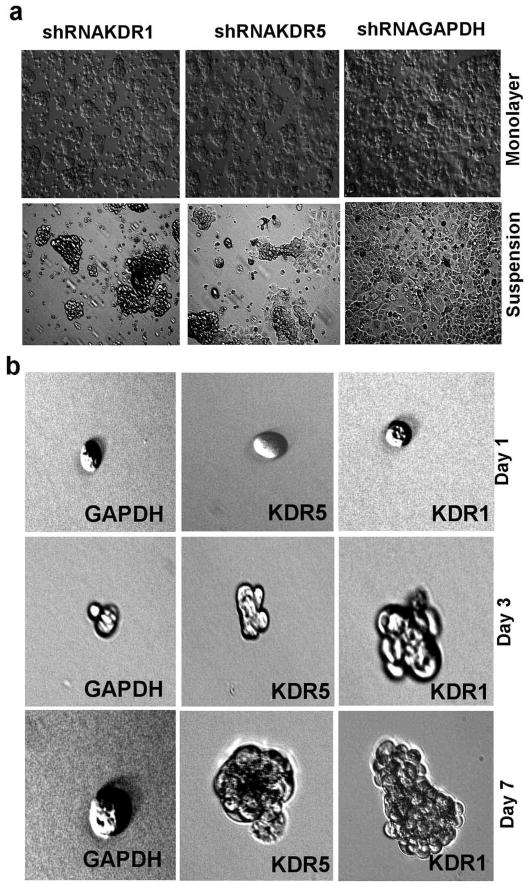
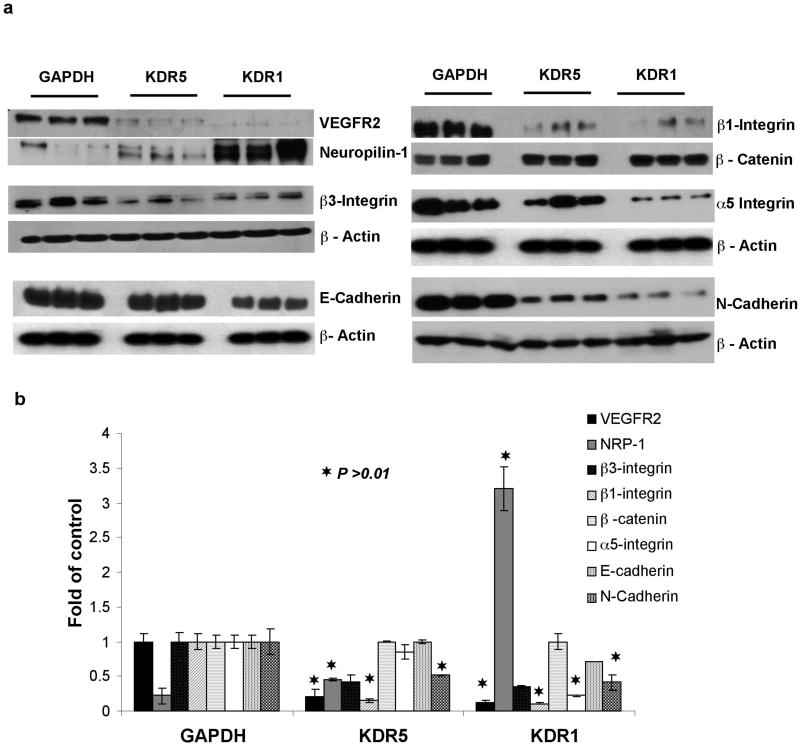
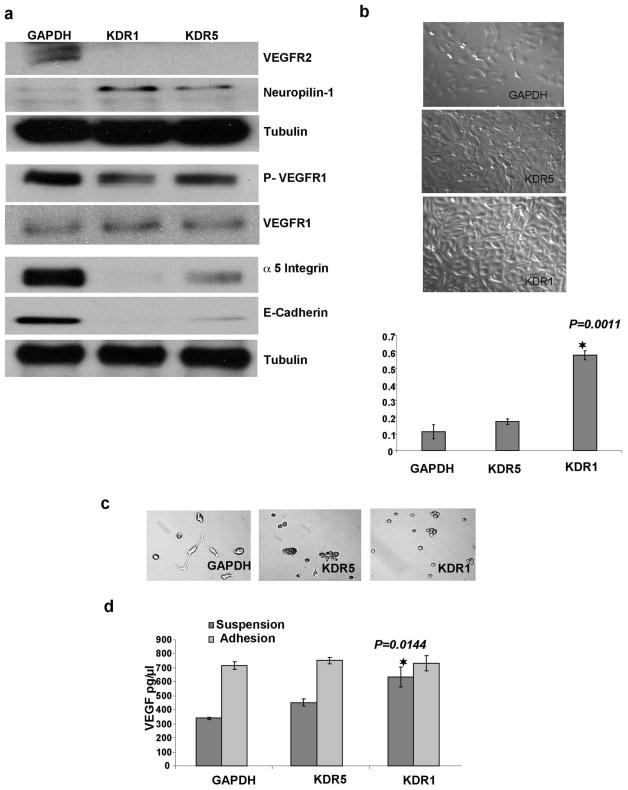
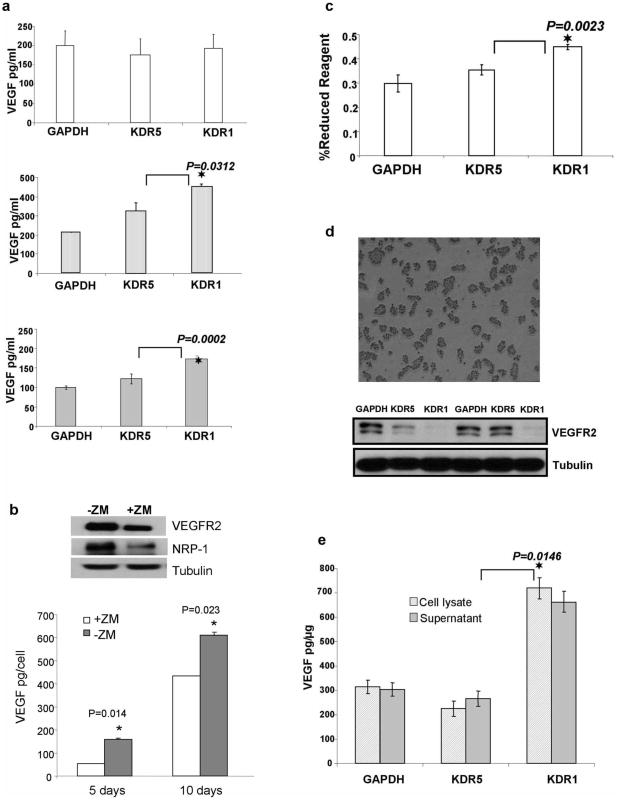
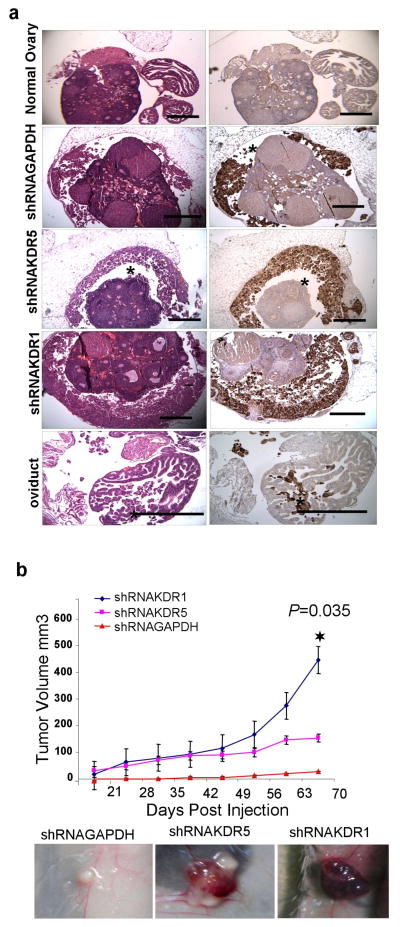
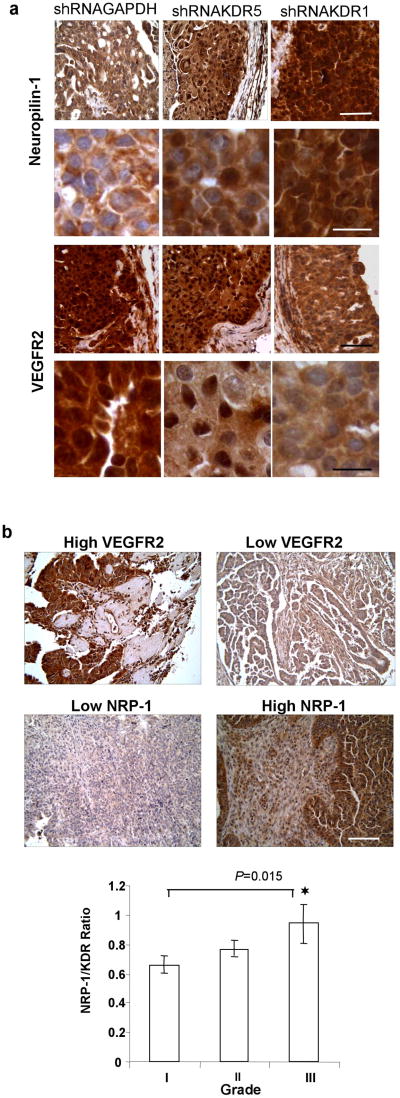
Human epithelial ovarian cancer (EOC) is the most lethal neoplasm affecting the female genital tract, and is characterized by overexpression of vascular endothelial growth factor (VEGF) and growth as ascites. Anti-VEGF strategies are currently used in EOC therapy with promising results; however, molecular targeting of specific VEGF receptors on the cancer cells themselves has not been explored to date. We previously showed that activation of a VEGF/VEGFR2 signaling loop in EOC cells supports their survival in suspension, and short-term pharmacological inhibition of this loop increased EOC cell apoptosis in vitro. In this study, we stably knocked down VEGFR2 in OVCAR-3 and SKOV-3 EOC cells using short hairpin RNA (shRNA), an RNA interference strategy that could potentially overcome chemoresistance arising with angiogenic inhibitors. Unexpectedly, we observed an induction of more aggressive cellular behavior in transfected cells, leading to increased growth in mouse xenografts, enhanced accumulation of ascites, increased VEGF and neuropilin-1 (NRP-1) expression, and decreased expression of adhesion proteins, notably cadherins and integrins. Sonic hedgehog (SHH) pathways do not seem to be involved in the upregulation of NRP-1 message in VEGFR2 knockdown cells. Supporting our mouse model, we also found a significant increase in the ratio between NRP-1 and VEGFR2 with increasing tumor grade in 80 cases of human EOC. The change in EOC behavior that we report in this study occurred independent of the angiogenic response and shows the direct effect of VEGF blockade on the cancer cells themselves. Our findings highlight the possible confounding events that may affect the usefulness of RNAi in a therapeutic setting for disrupting EOC cell survival in ascites.


Figures

Figure 1
Figure 1
VEGFR2 Knockdown and its Consequences. (a) Immunofluorescence staining of OVCAR-3 cells transiently transfected with 21 nucleotide siRNAKDR, scale bars = 100 μm. (b) Upper Western blot shows stable knockdown of VEGFR2 in OVCAR-3/GFP cells transfected with stable shRNA against two KDR sequences (KDR1, KDR5) and both controls (GAPDH and scrambled SRC), middle and lower panels: western blots showing VEGFR2 levels in 5 clones from each shRNA construct. Graph shows Mean (SEM) for densitometry readings from four different independent blots from clone 3 of shRNAKDR5 and clone 1 of shRNAKDR1. These clones were used for the subsequent experiments. (c) Ethidium bromide stained agarose gel of semi-quantitative RT-PCR reveals barely detectable levels of NRP-1 in parent OVCAR-3 cells, and enhanced levels in both KDR transfected shRNA cells. Graph of quantitative RT-PCR confirms that shRNAKDR cells express increased levels of NRP-1 compared to GAPDH control. (d) Western blot showing NRP-1 protein expression levels are higher in shRNAKDR knockdown OVCAR-3 cells inversely proportional to the extent of VEGFR2 knockdown compared to GAPDH control. The graph shows the inverse relationship between the expression of VEGFR2 and NRP-1; results are the Mean ± SEM of densitometry readings representing the knockdown of VEGFR2/NRP-1 from three different blots.
Figure 2
Figure 2
Changes in the expression of downstream signaling proteins and Gli-1 transcriptional factor upon KDR blockade. (a) Western blot showing expression levels and phosphorylation status of VEGFR1. VEGFR2 knockdown produced no change in VEGFR1 levels but concomitant decreases in its phosphorylation, compared to shRNAGAPDH controls. Two clones of each transfection are shown. (b) Western blot showing that VEGFR2 knockdown reduced levels of phosphorylated AKT and FAK, but did not change levels of phosphorylated ERK nor phosphorylated MAPK. (c) Upper panel: western blot showing no change in SHH protein expression in three clones of each KDR knockdown and control cells. The lower panel of western blot for Gli-1 transcription factor shows down regulation in two different clones of each shRNA transfection without any change in the control transfected shRNAGAPDH cells.
Figure 3
Figure 3
Change in the expression of adhesion proteins upon the loss of VEGFR2. (a) Phase contrast images of transfected OVCAR-3 cells growing as monolayers in adhesive plates and in flat bottom suspension plates. Images were captured 48 h after cell passage. (b) Single cells growing under suspension conditions for up to 7 days.
Figure 4
Figure 4
Quantification of adhesion protein changes upon VEGFR2 knockdown. (a) Western blots showing that knockdown of VEGFR2 in OVCAR-3 cells leads to increased NRP-1 protein and concomitant decreased expression of cell-matrix adhesion (β3, β1 and α5 integrins) and cell-cell adhesion (E-cadherin and N-cadherin) proteins compared to GAPDH RNAi cells. (b) Densitometry readings of three independent experiments detecting the expression of the eight proteins in three clones for each construct. Results are shown as Mean ± SEM (n=3). Asterisks indicate significantly different protein levels from GAPDH control cells (p ≤ 0.05).
Figure 5
Figure 5
shRNA knockdown of VEGFR2/KDR in SKOV-3 EOC cell line has the same effect on cell proliferation and gene expression observed in OVCAR-3 cells. (a) Western blots show increased NRP-1, decrease in p-VEGFR1, no change in native VEGFR1 and decrease in both α5 integrin and E-Cadherin in KDR knockdown cells. (b) Phase contrast images of transfected SKOV-3 grown in monolayer on adhesive plates for 24 hours after passage, shows the enhanced proliferation in KDR knockdown clones. SKOV-3 shRNAKDR1 cells show the highest proliferation and this was confirmed by Alamarblue assay data from three independent replicates (Mean ± SEM). (c) Phase contrast images of SKOV-3 cells grown in low density over 1% agarose (non-adhesive surface). shRNAGAPDH control cells are able to both attach and spread on agarose while adhesion is reduced in shRNAKDR5 and lost in shRNAKDR1. (d) Graph of VEGF ELISA (Mean ± SEM) demonstrates higher VEGF production by SKOV-3 shRNAKDR1 in suspension and not in adhesion compared to shRNAKDR5 and shRNAGAPDH.
Figure 6
Figure 6
Increased VEGF-A production in suspension conditions by VEGFR2 OVCAR-3 knockdown cells. (a) ELISA for VEGF-A (Mean ± SEM) detected no change in the amount of VEGF produced by the three OVCAR-3 transfected constructs growing in adhesive monolayer culture. The middle graph shows a significant increase in the production of VEGF-A by shRNAKDR1 clones growing in suspension and the bottom graph shows a significant increase in VEGF-A production by spheroids formed from shRNAKDR1 cells compared shRNAKDR5 and shKDRGAPDH. (b) Short term blockade of VEGFR2 signaling in OVCAR-3 cells with pharmacological inhibitor ZM323881 lead to reduced expression of VEGFR2, NRP-1 and VEGF. (c) Proliferation assay using AlamarBlue (Mean ± SEM) demonstrates significant cell growth in shRNAKDR1 cells compared to other clones. (d) Upper panel shows ascites (OVCAR-3 cells) collected from the intraperitoneal cavity of mice; bottom panel shows western blot of collected cells, demonstrating the stability of VEGFR2 knockdown in the recovered ascites cells. (e) ELISA results (Mean ± SEM) showing higher VEGF-A production in shRNAKDR1 ascites supernatant and lysed cells recovered from intraperitoneal cavities of injected mice, compared to samples from other stable lines.
Figure 7
Figure 7
Effect of KDR knockdown on the malignancy of OVCAR-3 cells in vivo. (a) Adjacent sections of ovaries stained with H&E, and immunostained for GFP to identify injected EOC cells. shRNAGAPDH cells showed modest colonization of ovary bursal space while shRNAKDR5 and shRNAKDR1 cells showed extensive colonization of ovarian bursal space (asterisks). Occasionally, injected EOC cells also infiltrated the oviduct of shRNAKDR1 injected mice. These observations were consistent in all five mice injected per cell type. Reproductive tracts from uninjected mice showed no evidence of cellular infiltration or GFP staining. Scale bar = 500 μm. (b) Tumor growth curves for EOC subcutaneous xenografts, graph showing Mean, ± SEM. During the 12 weeks of the trial, all shRNA KDR injected mice grew tumors (N=5 per group) and tumors from cells with the most extensive KDR knockdown (shRNAKDR1) grew significantly larger than tumors generated from shRNAKDR5. In contrast, when shRNAGAPDH control cells were injected (N=5), only one slow growing tumor formed. Inserts are representative images of the subcutaneous xenografts in situ prior to dissection.
Figure 8
Figure 8
NRP-1 and VEGFR2 immunohistochemistry (a) Tumor sections from shRNAKDR1 xenografts reveal significantly increased staining of NRP-1 and reduced VEGFR2 staining. Upper panels: Low power (top row) and high power (bottom row) images of EOC xenografts stained for NRP-1. Note that tissue from xenografts created from both shRNA transfected cell lines (KDR1 and KDR5) have higher levels of NRP-1 expression compared to control tumor, which shows slight cytoplasmic staining (Scale bar: top row 20 μm; bottom row, 50 μm). Lower panels: Low power (top row) and high power (bottom row) images of EOC xenografts stained for VEGFR2. Note the shift in the expression of VEGFR2 from both cytoplasmic and nuclear in control tumors, to nuclear only in KDR5 tumors to weakly cytosolic in KDR1 tumors. (Scale bar: top row 20 μm; bottom row, 50 μm). (b) Higher NRP-1/VEGFR2 ratio in 80 human clinical EOC biopsies. Representative tissues from Human EOC tissue microarray stained with VEGFR2 or NRP-1 showing the range of expression in human tumor samples. Scale bar = 50 μm. Graph shows ratio of NRP-1:VEGFR2 score from 80 EOC specimens and reveals significantly increasing ratio between tumor grade I and III.

Similar articles

Cited by

References

    1. Dinulescu DM, Ince TA, Quade BJ, et al. Role of K-ras and pten in the development of mouse models of endometriosis and endometrioid ovarian cancer. Nat Med. 2005;11:63–70. - PubMed
    1. Look M, Chang D, Sugarbaker PH, et al. Long-term results of cytoreductive surgery for advanced and recurrent epithelial ovarian cancers and papillary serous carcinoma of the peritoneum. Int J Gynecol Cancer. 2003;13:764–770. - PubMed
    1. Bergers G, Hanahan D. Modes of resistance to anti-angiogenic therapy. Nat Rev Cancer. 2008;8:592–603. - PMC - PubMed
    1. Akutagawa N, Nishikawa A, Iwasaki M, et al. Expression of vascular endothelial growth factor and E-cadherin in human ovarian cancer: Association with ascites fluid accumulation and peritoneal dissemination in mouse ascites model. Jpn J Cancer Res. 2002;93:644–651. - PMC - PubMed
    1. Wey JS, Stoeltzing O, Ellis LM, et al. Vascular endothelial growth factor receptors: Expression and function in solid tumors. Clin Adv Hematol Oncol. 2004;2:37–45. - PubMed

Publication types

MeSH terms

Substances