Review
. 2010 Mar;7(3 Suppl):S42-55.
doi: 10.1038/nmeth.1427. Epub 2010 Mar 1.

Visualization of macromolecular structures

Affiliations
Review

Visualization of macromolecular structures

Seán I O'Donoghue et al. Nat Methods. 2010 Mar.

Abstract

Structural biology is rapidly accumulating a wealth of detailed information about protein function, binding sites, RNA, large assemblies and molecular motions. These data are increasingly of interest to a broader community of life scientists, not just structural experts. Visualization is a primary means for accessing and using these data, yet visualization is also a stumbling block that prevents many life scientists from benefiting from three-dimensional structural data. In this review, we focus on key biological questions where visualizing three-dimensional structures can provide insight and describe available methods and tools.


Conflict of interest statement

The authors declare no competing financial interests.

Figures
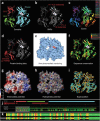
Figure 1
Figure 1. Visualizing a tyrosine kinase structure (PDB 1QCF).
(ad,f) A simple way to gain insight into function is to use ribbon representation colored by sequence features: for example, domains (a), SNPs (b), exons (c), protein binding sites (d) and sequence conservation (f). (e) An effective way to show overall shape is with nonphotorealistic rendering using flat colors and outlines. (g,h) Solvent-accessible surfaces are often used for displaying electrostatic (g) and hydrophobic potentials (h; hydrophilic in saturated colors and hydrophobic in white). (i) Superposition is commonly used to compare two or more related structures—for example, two distinct states of the same protein, or, as shown here, two separate proteins with similar structure (PDB 1QCF and 1FMK). (j,k) Increasingly many tools have an integrated, interactive sequence viewer, which helps users understand the relationship between sequence and three-dimensional structure. Images were made using SRS 3D (ad,f,j,k), PMV (e,g,h) and RCSB PDB (i).
Figure 2
Figure 2. Caution for beginners: symmetry in crystal structures.
PDB entries often do not have explicit three-dimensional coordinates for all parts of symmetric oligomers. (a,b) For example, in PDB 2C2A, coordinates are given for only one monomer (a), although the biologically active state is a homodimer (b). (ae) Usually this information is given in 'REMARK 350', however we recommend using PISA, which automatically constructs a range of assemblies that occur in the crystal and predicts which of these is most biologically relevant. In this case, PISA gives the asymmetric unit (a), three dimer forms (b,c,d) and the unit cell (e). Increasingly, sites such as RCSB PDB provide the biologically relevant assembly precalculated with PISA. Image of PISA output made using VMD.
Figure 3
Figure 3. Visualization of an NMR ensemble for SH3 (ref. 108).
(a,b) NMR structures are typically deposited in the PDB as an ensemble of superimposed structures (a), with the spread of the ensemble giving an indication of precision, but not of accuracy. The 'sausage' representation (b) gives an informative summary of an ensemble by adjusting the width of the tube to match to the width of the ensemble. Images made using MOLMOL (a) and VMD (b).
Figure 4
Figure 4. Visualizing ligand-binding sites.
(a) A useful initial view is to show ligands and binding site residues in ball-and-stick and wire-frame representations, respectively. Here, an inhibitor is shown bound to HIV protease (PDB 1HVR). (b) Visualizing the same binding site using a molecular surface colored by atom type reveals the catalytic oxygen atoms (center, red). (c) Here, AutoLigand has been used to find regions that might bind a ligand-sized molecule. (d) Two structures of the same protein (estrogen receptor) superimposed using Relibase,, one with estrogen (blue, PDB 1QKU), a second with an antagonist (red, PDB 1ERR), give insight into the antagonist mechanism. (e) All 74 structures of human estrogen receptor compared using PDBsum, showing estrogen (red) and cofactors (green). (f) Comparing binding sites of related structures can give insight into drug specificity. Image shows estrogen receptor (green), progesterone receptor (gray) and androgen receptor (orange). (g,h) Simplified two-dimensional schematics can be useful for visualizing binding site interactions, such as hydrogen bonds (dashed lines), unbonded contacts ('eyelashes', g) and hydrophobic interactions (green curves, h). (i) To study drug specificity, interaction networks can be used to show all proteins known to interact with a drug. Images made using SRS 3D (a), PMV (b,c), OpenAstexViewer (d), Jmol (e), MOE (f), LIGPLOT (g), PoseView (h) and STITCH (i).
Figure 5
Figure 5. Visualization of RNA structure in one, two and three dimensions.
Viewing multiple sequence alignment simultaneously with two-and three-dimensional representations greatly helps in assigning two-dimensional structure and understanding function. This process is aided by synchronizing colors in all three views. The RNA structure shown is from SARS virus, and the image was made using S2S Assemble with PyMOL.
Figure 6
Figure 6. Visualizations of molecular motion.
(a) Four snapshots from a molecular dynamics simulation visualized (darker protein coloring indicating later snapshots). A ligand is shown moving from its initial position buried in an active site (right) to the protein exterior (left). (b) Same four snapshots using a simplified representation highlighting residues undergoing conformational changes as the ligand escapes. The contoured surface (generated with CAVER) shows changes to the transient tunnel used by the ligand. (ce) Visualization of protein-protein diffusion simulations made using SDA (http://tinyurl.com/SDA-EML/). (c) Representative trajectory of a protein (blue) diffusing around a second, target protein (orange). (d) Isocontours (blue) show the region most occupied by the diffusing protein during thousands of trajectories. Target protein, orange. (e) Two-dimensional map of occupancy versus protein-protein center-to-center distance; blue, the most occupied region.
Figure 7
Figure 7. Two examples of multiscale, hierarchical visualization.
(a) An atomic structure of an antibody (bottom) was used to create a smoothed surface as part of a more complex scene of blood serum (top). Images made with AVS (http://www.avs.com/) and PMV. (b) Top, a 2.4-nm electron tomogram slice of a human skin section showing part of the nuclear envelope (blue), cytoplasm (black background) and a desmosome (orange) at the boundary of the two cells. Using sub-tomogram averaging, the interaction of cadherin proteins can be resolved, and they were used to calculate isosurfaces (below) into which the atomic-detail structure of C-cadherins has been fitted. Images created using MATLAB and Amira. Scale bars, 10 nm.
Figure 8
Figure 8. Tangible models in research.
Tangible models were used to explore the modes of self-assembly of viral capsids. (a) The electrostatic and charge complementarity is displayed using isosurfaces for the protein and electrostatic potential. (b) Affordances for placement of magnets were designed into the protein surface using constructive solid geometry methods. (c) Physical models were built and fitted with magnets. Twelve pentameric subunits then self-assemble when shaken for several minutes in a tube. Images created with PMV. (d) An augmented-reality interface used to study molecular interactions of the enzyme superoxide dismutase. An inexpensive video camera (not in the picture) views the models, and embedded markers on the surface (small black squares) are used to determine the orientation of the model from the video image. Volume-rendered electrostatic potentials and small animated arrows for the electrostatic field vectors are then overlapped onto the video image, following the video image as the user manipulates the model.

Similar articles

Cited by

  • Nanoinformatics: developing new computing applications for nanomedicine.
    Maojo V, Fritts M, Martin-Sanchez F, De la Iglesia D, Cachau RE, Garcia-Remesal M, Crespo J, Mitchell JA, Anguita A, Baker N, Barreiro JM, Benitez SE, De la Calle G, Facelli JC, Ghazal P, Geissbuhler A, Gonzalez-Nilo F, Graf N, Grangeat P, Hermosilla I, Hussein R, Kern J, Koch S, Legre Y, Lopez-Alonso V, Lopez-Campos G, Milanesi L, Moustakis V, Munteanu C, Otero P, Pazos A, Perez-Rey D, Potamias G, Sanz F, Kulikowski C. Maojo V, et al. Comput Sci Eng. 2012 Jun 1;94(6):521-539. doi: 10.1007/s00607-012-0191-2. Epub 2012 Mar 7. Comput Sci Eng. 2012. PMID: 22942787 Free PMC article.
  • Visualizing ensembles in structural biology.
    Melvin RL, Salsbury FR Jr. Melvin RL, et al. J Mol Graph Model. 2016 Jun;67:44-53. doi: 10.1016/j.jmgm.2016.05.001. Epub 2016 May 4. J Mol Graph Model. 2016. PMID: 27179343 Free PMC article.
  • Grand Challenges in Bioinformatics Data Visualization.
    O'Donoghue SI. O'Donoghue SI. Front Bioinform. 2021 Jun 17;1:669186. doi: 10.3389/fbinf.2021.669186. eCollection 2021. Front Bioinform. 2021. PMID: 36303723 Free PMC article. No abstract available.
  • Strategies for the Production of Molecular Animations.
    Werner E. Werner E. Front Bioinform. 2022 May 16;2:793914. doi: 10.3389/fbinf.2022.793914. eCollection 2022. Front Bioinform. 2022. PMID: 36304328 Free PMC article. Review.
  • Visualization of omics data for systems biology.
    Gehlenborg N, O'Donoghue SI, Baliga NS, Goesmann A, Hibbs MA, Kitano H, Kohlbacher O, Neuweger H, Schneider R, Tenenbaum D, Gavin AC. Gehlenborg N, et al. Nat Methods. 2010 Mar;7(3 Suppl):S56-68. doi: 10.1038/nmeth.1436. Nat Methods. 2010. PMID: 20195258 Review.

References

    1. Berman H, Henrick K, Nakamura H. Announcing the worldwide Protein Data Bank. Nat. Struct. Biol. 2003;10:980. - PubMed
    1. Goddard TD, Ferrin TE. Visualization software for molecular assemblies. Curr. Opin. Struct. Biol. 2007;17:587–595. - PMC - PubMed
    1. Tate J. Molecular visualization. Methods Biochem. Anal. 2003;44:135–158. - PubMed
    1. Olson AJ, Pique ME. Visualizing the future of molecular graphics. SAR QSAR Environ. Res. 1998;8:233–247. - PubMed
    1. Berman HM, et al. The Protein Data Bank. Nucleic Acids Res. 2000;28:235–242. - PMC - PubMed

Publication types

Substances