

A color hierarchy for automatic target selection
- PMID: 20195361
- PMCID: PMC2827542
- DOI: 10.1371/journal.pone.0009338
A color hierarchy for automatic target selection
Abstract
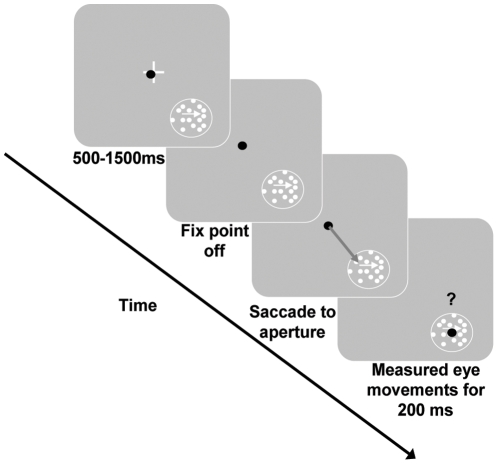
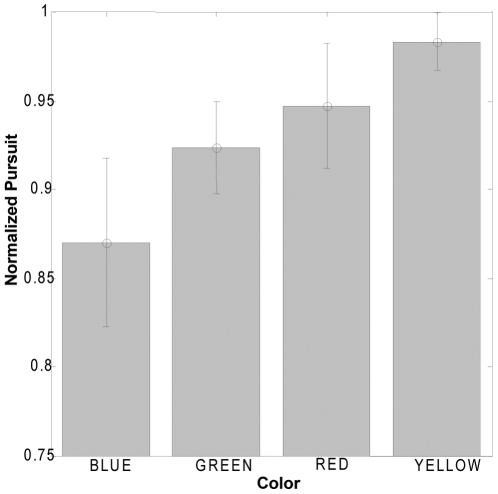
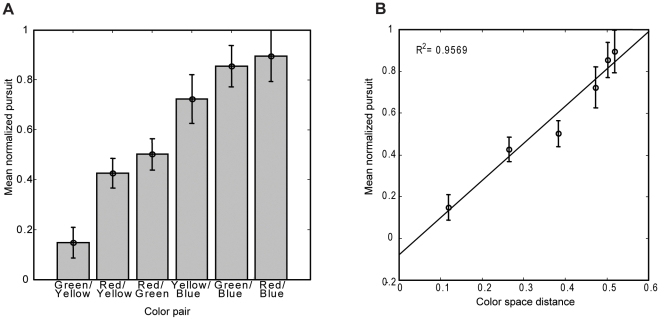
Visual processing of color starts at the cones in the retina and continues through ventral stream visual areas, called the parvocellular pathway. Motion processing also starts in the retina but continues through dorsal stream visual areas, called the magnocellular system. Color and motion processing are functionally and anatomically discrete. Previously, motion processing areas MT and MST have been shown to have no color selectivity to a moving stimulus; the neurons were colorblind whenever color was presented along with motion. This occurs when the stimuli are luminance-defined versus the background and is considered achromatic motion processing. Is motion processing independent of color processing? We find that motion processing is intrinsically modulated by color. Color modulated smooth pursuit eye movements produced upon saccading to an aperture containing a surface of coherently moving dots upon a black background. Furthermore, when two surfaces that differed in color were present, one surface was automatically selected based upon a color hierarchy. The strength of that selection depended upon the distance between the two colors in color space. A quantifiable color hierarchy for automatic target selection has wide-ranging implications from sports to advertising to human-computer interfaces.
Conflict of interest statement
Figures
Similar articles
-
Improved visual sensitivity during smooth pursuit eye movements.Nat Neurosci. 2008 Oct;11(10):1211-6. doi: 10.1038/nn.2194. Epub 2008 Sep 21. Nat Neurosci. 2008. PMID: 18806785
-
Contextual effects on motion perception and smooth pursuit eye movements.Brain Res. 2008 Aug 15;1225:76-85. doi: 10.1016/j.brainres.2008.04.061. Epub 2008 Apr 30. Brain Res. 2008. PMID: 18538748 Review.
-
The effect of a moving distractor on the initiation of smooth-pursuit eye movements.Vis Neurosci. 1997 Mar-Apr;14(2):323-38. doi: 10.1017/s0952523800011457. Vis Neurosci. 1997. PMID: 9147484
-
Improved visual sensitivity during smooth pursuit eye movements: temporal and spatial characteristics.Vis Neurosci. 2009 May-Jun;26(3):329-40. doi: 10.1017/S0952523809990083. Epub 2009 Jul 15. Vis Neurosci. 2009. PMID: 19602304
-
Do we track what we see? Common versus independent processing for motion perception and smooth pursuit eye movements: a review.Vision Res. 2011 Apr 22;51(8):836-52. doi: 10.1016/j.visres.2010.10.017. Epub 2010 Oct 20. Vision Res. 2011. PMID: 20965208 Review.
Cited by
-
Feature integration and object representations along the dorsal stream visual hierarchy.Front Comput Neurosci. 2014 Aug 5;8:84. doi: 10.3389/fncom.2014.00084. eCollection 2014. Front Comput Neurosci. 2014. PMID: 25140147 Free PMC article. Review.
-
Approach in green, avoid in red? Examining interindividual variabilities and personal color preferences through continuous measures of specific meaning associations.Psychol Res. 2023 Jun;87(4):1232-1242. doi: 10.1007/s00426-022-01732-5. Epub 2022 Sep 7. Psychol Res. 2023. PMID: 36071301
-
Influence of obstacle color on locomotor and gaze behaviors during obstacle avoidance in people with Parkinson's disease.Exp Brain Res. 2018 Dec;236(12):3319-3325. doi: 10.1007/s00221-018-5385-1. Epub 2018 Sep 25. Exp Brain Res. 2018. PMID: 30255196
-
Perceptual Color Space Representations in the Oculomotor System Are Modulated by Surround Suppression and Biased Selection.Front Syst Neurosci. 2018 Jan 26;12:1. doi: 10.3389/fnsys.2018.00001. eCollection 2018. Front Syst Neurosci. 2018. PMID: 29434540 Free PMC article.
-
Color improves speed of processing but not perception in a motion illusion.Front Psychol. 2012 Mar 29;3:92. doi: 10.3389/fpsyg.2012.00092. eCollection 2012. Front Psychol. 2012. PMID: 22479255 Free PMC article.
References
-
- Corbetta M, Miezin FM, Dobmeyer S, Shulman GL, Petersen SE. Attentional modulation of neural processing of shape, color and velocity in humans. Science. 1990;248:1556–1559. - PubMed
-
- Shipp S, Zeki S. Segregation of pathways leading from area V2 to areas V4 and V5 of macaque monkey visual cortex. Nature. 1985;15:322–325. - PubMed
-
- Tootell RB, Dale AM, Sereno MI, Malach R. New images from human visual cortex. Trends Neurosci. 1996;19:481–489. - PubMed
-
- Cavanagh P, Anstis S. The contribution of color to motion in normal and color-deficient observers. Vision Res. 1991;31:2109–2148. - PubMed
Publication types
MeSH terms
LinkOut - more resources
Full Text Sources
