Caloric restriction shortens lifespan through an increase in lipid peroxidation, inflammation and apoptosis in the G93A mouse, an animal model of ALS
- PMID: 20195368
- PMCID: PMC2827549
- DOI: 10.1371/journal.pone.0009386
Caloric restriction shortens lifespan through an increase in lipid peroxidation, inflammation and apoptosis in the G93A mouse, an animal model of ALS
Abstract
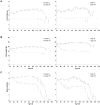
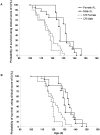
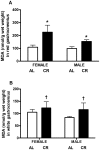
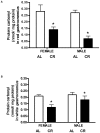
Caloric restriction (CR) extends lifespan through a reduction in oxidative stress, delays the onset of morbidity and prolongs lifespan. We previously reported that long-term CR hastened clinical onset, disease progression and shortened lifespan, while transiently improving motor performance in G93A mice, a model of amyotrophic lateral sclerosis (ALS) that shows increased free radical production. To investigate the long-term CR-induced pathology in G93A mice, we assessed the mitochondrial bioenergetic efficiency and oxidative capacity (CS--citrate synthase content and activity, cytochrome c oxidase--COX activity and protein content of COX subunit-I and IV and UCP3-uncoupling protein 3), oxidative damage (MDA--malondialdehyde and PC--protein carbonyls), antioxidant enzyme capacity (Mn-SOD, Cu/Zn-SOD and catalase), inflammation (TNF-alpha), stress response (Hsp70) and markers of apoptosis (Bax, Bcl-2, caspase 9, cleaved caspase 9) in their skeletal muscle. At age 40 days, G93A mice were divided into two groups: Ad libitum (AL; n = 14; 7 females) or CR (n = 13; 6 females), with a diet equal to 60% of AL. COX/CS enzyme activity was lower in CR vs. AL male quadriceps (35%), despite a 2.3-fold higher COX-IV/CS protein content. UCP3 was higher in CR vs. AL females only. MnSOD and Cu/Zn-SOD were higher in CR vs. AL mice and CR vs. AL females. MDA was higher (83%) in CR vs. AL red gastrocnemius. Conversely, PC was lower in CR vs. AL red (62%) and white (30%) gastrocnemius. TNF-alpha was higher (52%) in CR vs. AL mice and Hsp70 was lower (62%) in CR vs. AL quadriceps. Bax was higher in CR vs. AL mice (41%) and CR vs. AL females (52%). Catalase, Bcl-2 and caspases did not differ. We conclude that CR increases lipid peroxidation, inflammation and apoptosis, while decreasing mitochondrial bioenergetic efficiency, protein oxidation and stress response in G93A mice.
Conflict of interest statement
Figures


Similar articles
-
Transient caloric restriction in early adulthood hastens disease endpoint in male, but not female, Cu/Zn-SOD mutant G93A mice.Muscle Nerve. 2006 Dec;34(6):709-19. doi: 10.1002/mus.20630. Muscle Nerve. 2006. PMID: 16941656
-
Caloric restriction transiently improves motor performance but hastens clinical onset of disease in the Cu/Zn-superoxide dismutase mutant G93A mouse.Muscle Nerve. 2005 Feb;31(2):214-20. doi: 10.1002/mus.20255. Muscle Nerve. 2005. PMID: 15625688
-
Cytochrome c association with the inner mitochondrial membrane is impaired in the CNS of G93A-SOD1 mice.J Neurosci. 2005 Jan 5;25(1):164-72. doi: 10.1523/JNEUROSCI.3829-04.2005. J Neurosci. 2005. PMID: 15634778 Free PMC article.
-
On the relation of oxidative stress to neuroinflammation: lessons learned from the G93A-SOD1 mouse model of amyotrophic lateral sclerosis.Antioxid Redox Signal. 2006 Nov-Dec;8(11-12):2075-87. doi: 10.1089/ars.2006.8.2075. Antioxid Redox Signal. 2006. PMID: 17034351 Review.
-
Strain-specific metabolic responses to long-term caloric restriction in female ILSXISS recombinant inbred mice.Mol Cell Endocrinol. 2021 Sep 15;535:111376. doi: 10.1016/j.mce.2021.111376. Epub 2021 Jul 9. Mol Cell Endocrinol. 2021. PMID: 34246728 Free PMC article. Review.
Cited by
-
Molecular mechanisms underlying genotype-dependent responses to dietary restriction.Aging Cell. 2013 Dec;12(6):1050-61. doi: 10.1111/acel.12130. Epub 2013 Aug 11. Aging Cell. 2013. PMID: 23837470 Free PMC article.
-
Metabolic Dysfunction in Spinal Muscular Atrophy.Int J Mol Sci. 2021 May 31;22(11):5913. doi: 10.3390/ijms22115913. Int J Mol Sci. 2021. PMID: 34072857 Free PMC article. Review.
-
Decreased expression level of apoptosis-related genes and/or proteins in skeletal muscles, but not in hearts, of growth hormone receptor knockout mice.Exp Biol Med (Maywood). 2011 Feb;236(2):156-68. doi: 10.1258/ebm.2010.010202. Exp Biol Med (Maywood). 2011. PMID: 21321312 Free PMC article.
-
Risk Factors and Emerging Therapies in Amyotrophic Lateral Sclerosis.Int J Mol Sci. 2019 May 28;20(11):2616. doi: 10.3390/ijms20112616. Int J Mol Sci. 2019. PMID: 31141951 Free PMC article. Review.
-
Neuroprotective effects of dantrolene in neurodegenerative disease: Role of inhibition of pathological inflammation.J Anesth Transl Med. 2024 Jun;3(2):27-35. doi: 10.1016/j.jatmed.2024.04.002. Epub 2024 Apr 30. J Anesth Transl Med. 2024. PMID: 38826587 Free PMC article.
References
-
- Haverkamp LJ, Appel V, Appel SH. Natural history of amyotrophic lateral sclerosis in a database population. Validation of a scoring system and a model for survival prediction. Brain. 1995; 118 (Pt 3):707–719. - PubMed
-
- Simpson EP, Yen AA, Appel SH. Oxidative Stress: a common denominator in the pathogenesis of amyotrophic lateral sclerosis. Curr Opin Rheumatol. 2003; 15:730–736. - PubMed
-
- Barja G, Cadenas S, Rojas C, Lopez-Torres M, Perez-Campo R. A decrease of free radical production near critical targets as a cause of maximum longevity in animals. Comp Biochem Physiol Biochem Mol Biol. 1994; 108:501–512. - PubMed
-
- Gredilla R, Sanz A, Lopez-Torres M, Barja G. Caloric restriction decreases mitochondrial free radical generation at complex I and lowers oxidative damage to mitochondrial DNA in the rat heart. Faseb J. 2001; 15:1589–1591. - PubMed
-
- Kalani R, Judge S, Carter C, Pahor M, Leeuwenburgh C. Effects of caloric restriction and exercise on age-related, chronic inflammation assessed by C-reactive protein and interleukin-6. J Gerontol A Biol Sci Med Sci. 2006; 61:211–217. - PubMed
Publication types
MeSH terms
Substances
Grants and funding
LinkOut - more resources
Full Text Sources
Other Literature Sources
Molecular Biology Databases
Research Materials
Miscellaneous

