

Gene expression profiles identify inflammatory signatures in dendritic cells
- PMID: 20195376
- PMCID: PMC2827557
- DOI: 10.1371/journal.pone.0009404
Gene expression profiles identify inflammatory signatures in dendritic cells
Erratum in
- PLoS One. 2010;5(6). doi: 10.1371/annotation/53736770-ad30-4c6b-8279-d344a1232cc6
Abstract
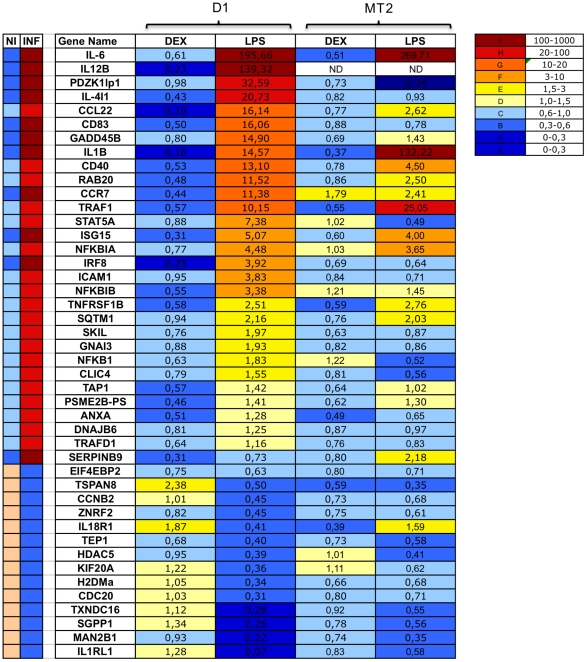
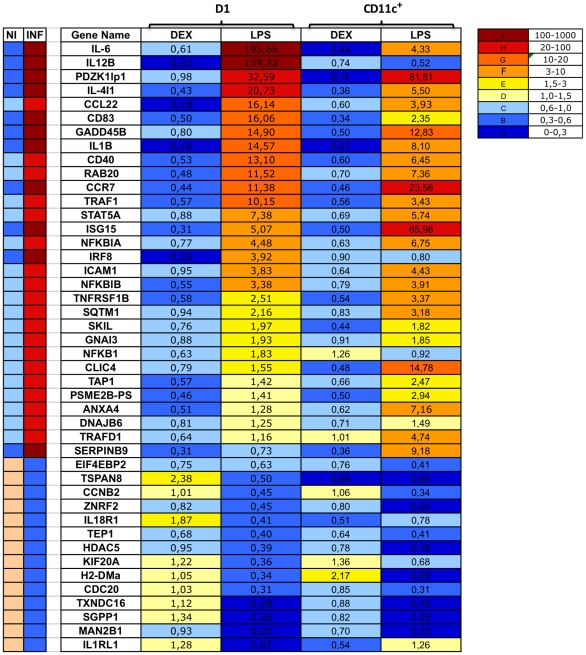
Dendritic cells (DCs) constitute a heterogeneous group of antigen-presenting leukocytes important in activation of both innate and adaptive immunity. We studied the gene expression patterns of DCs incubated with reagents inducing their activation or inhibition. Total RNA was isolated from DCs and gene expression profiling was performed with oligonucleotide microarrays. Using a supervised learning algorithm based on Random Forest, we generated a molecular signature of inflammation from a training set of 77 samples. We then validated this molecular signature in a testing set of 38 samples. Supervised analysis identified a set of 44 genes that distinguished very accurately between inflammatory and non inflammatory samples. The diagnostic performance of the signature genes was assessed against an independent set of samples, by qRT-PCR. Our findings suggest that the gene expression signature of DCs can provide a molecular classification for use in the selection of anti-inflammatory or adjuvant molecules with specific effects on DC activity.
Conflict of interest statement
Figures


Similar articles
-
Modulation of gene expression related to Toll-like receptor signaling in dendritic cells by poly(gamma-glutamic acid) nanoparticles.Clin Vaccine Immunol. 2010 May;17(5):748-56. doi: 10.1128/CVI.00505-09. Epub 2010 Mar 10. Clin Vaccine Immunol. 2010. PMID: 20219877 Free PMC article.
-
Genome-wide analysis of gene expression in dendritic cells from rat regenerating liver after partial hepatectomy.Cell Biochem Funct. 2011 Apr;29(3):255-64. doi: 10.1002/cbf.1748. Epub 2011 Mar 21. Cell Biochem Funct. 2011. PMID: 21425182
-
Analysis of genes regulated by the transcription factor LUMAN identifies ApoA4 as a target gene in dendritic cells.Mol Immunol. 2012 Feb;50(1-2):66-73. doi: 10.1016/j.molimm.2011.12.003. Epub 2011 Dec 30. Mol Immunol. 2012. PMID: 22209087
-
Tolerogenic dendritic cells show gene expression profiles that are different from those of immunogenic dendritic cells in DBA/1 mice.Autoimmunity. 2016;49(2):90-101. doi: 10.3109/08916934.2015.1124424. Epub 2015 Dec 24. Autoimmunity. 2016. PMID: 26699759
-
Gene expression profiling of dendritic cells by DNA microarrays.Immunobiology. 2004;209(1-2):155-61. doi: 10.1016/j.imbio.2004.02.005. Immunobiology. 2004. PMID: 15481149 Review.
Cited by
-
ImpulseDE: detection of differentially expressed genes in time series data using impulse models.Bioinformatics. 2017 Mar 1;33(5):757-759. doi: 10.1093/bioinformatics/btw665. Bioinformatics. 2017. PMID: 27797772 Free PMC article.
-
Transcriptional changes in dendritic cells underlying allergen specific induced tolerance in a mouse model.Sci Rep. 2022 Feb 18;12(1):2797. doi: 10.1038/s41598-022-06186-8. Sci Rep. 2022. PMID: 35181694 Free PMC article.
-
Gene expression profiling of dendritic cells reveals important mechanisms associated with predisposition to Staphylococcus infections.PLoS One. 2011;6(8):e22147. doi: 10.1371/journal.pone.0022147. Epub 2011 Aug 12. PLoS One. 2011. PMID: 21857913 Free PMC article.
-
TLR agonists downregulate H2-O in CD8alpha- dendritic cells.J Immunol. 2011 Oct 15;187(8):4151-60. doi: 10.4049/jimmunol.1003137. Epub 2011 Sep 14. J Immunol. 2011. PMID: 21918198 Free PMC article.
-
Neddylation plays an important role in the regulation of murine and human dendritic cell function.Blood. 2013 Sep 19;122(12):2062-73. doi: 10.1182/blood-2013-02-486373. Epub 2013 Jul 17. Blood. 2013. PMID: 23863900 Free PMC article.
References
-
- Steinman RM, Banchereau J. Taking dendritic cells into medicine. Nature. 2007;449:419–426. - PubMed
-
- Foti M, Granucci F, Ricciardi-Castagnoli P. A central role for tissue-resident dendritic cells in innate responses. Trends Immunol. 2004;25:650–654. - PubMed
-
- Foti M, Granucci F, Ricciardi-Castagnoli P. Dendritic cell interactions and cytokine production. Ernst Schering Res Found Workshop. 2006:61–80. - PubMed
-
- Akira S, Takeda K, Kaisho T. Toll-like receptors: critical proteins linking innate and acquired immunity. Nat Immunol. 2001;2:675–680. - PubMed
-
- Medzhitov R, Janeway C., Jr Innate immunity. N Engl J Med. 2000;343:338–344. - PubMed
Publication types
MeSH terms
Substances
LinkOut - more resources
Full Text Sources
Molecular Biology Databases
