. 2010 Feb 26;6(2):e1000789.
doi: 10.1371/journal.ppat.1000789.

Differentiation, distribution and gammadelta T cell-driven regulation of IL-22-producing T cells in tuberculosis

Affiliations

Differentiation, distribution and gammadelta T cell-driven regulation of IL-22-producing T cells in tuberculosis

Shuyu Yao et al. PLoS Pathog. .

Abstract

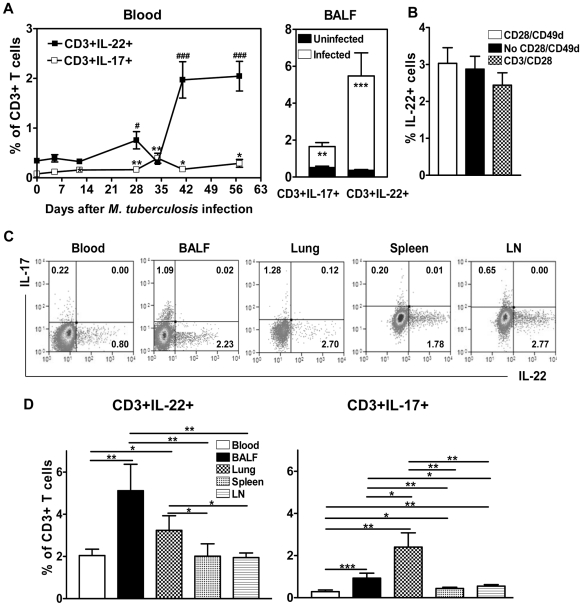
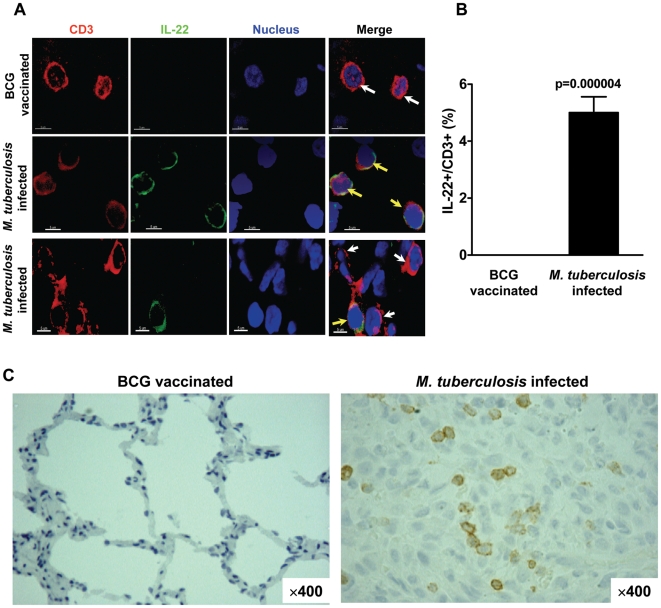
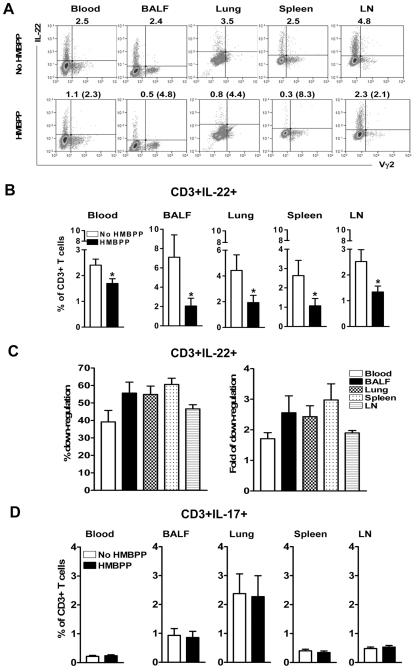
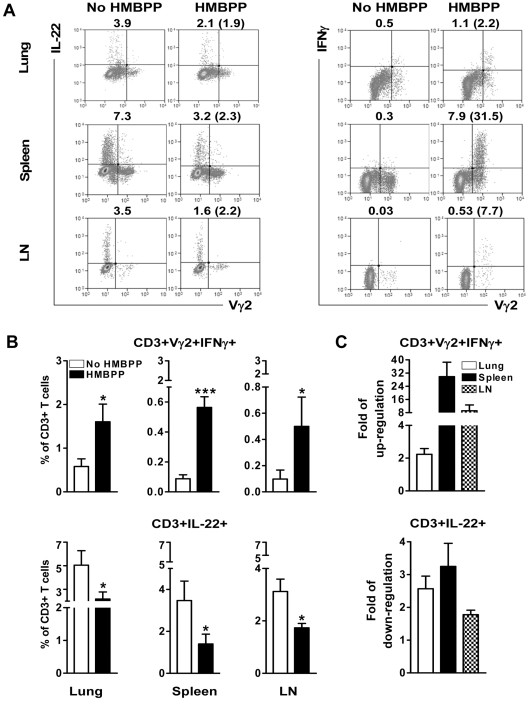
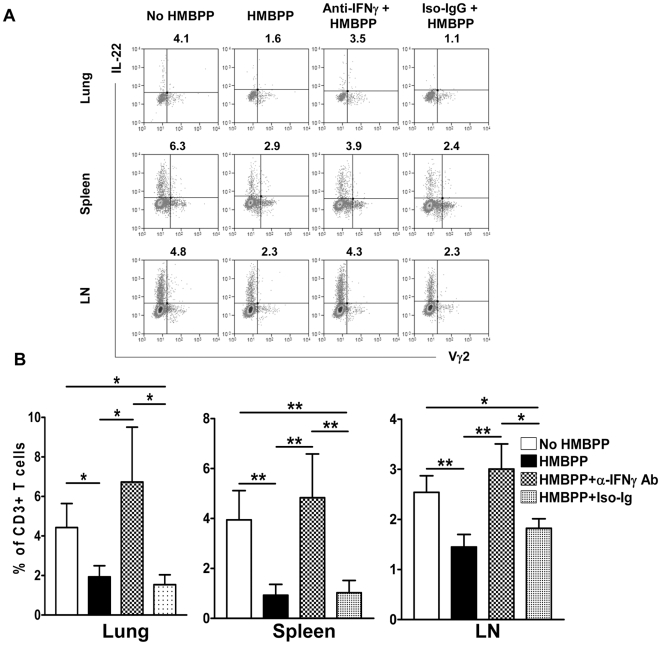
Differentiation, distribution and immune regulation of human IL-22-producing T cells in infections remain unknown. Here, we demonstrated in a nonhuman primate model that M. tuberculosis infection resulted in apparent increases in numbers of T cells capable of producing IL-22 de novo without in vitro Ag stimulation, and drove distribution of these cells more dramatically in lungs than in blood and lymphoid tissues. Consistently, IL-22-producing T cells were visualized in situ in lung tuberculosis (TB) granulomas by confocal microscopy and immunohistochemistry, indicating that mature IL-22-producing T cells were present in TB granuloma. Surprisingly, phosphoantigen HMBPP activation of Vgamma2Vdelta2 T cells down-regulated the capability of T cells to produce IL-22 de novo in lymphocytes from blood, lung/BAL fluid, spleen and lymph node. Up-regulation of IFNgamma-producing Vgamma2Vdelta2 T effector cells after HMBPP stimulation coincided with the down-regulated capacity of these T cells to produce IL-22 de novo. Importantly, anti-IFNgamma neutralizing Ab treatment reversed the HMBPP-mediated down-regulation effect on IL-22-producing T cells, suggesting that Vgamma2Vdelta2 T-cell-driven IFNgamma-networking function was the mechanism underlying the HMBPP-mediated down-regulation of the capability of T cells to produce IL-22. These novel findings raise the possibility to ultimately investigate the function of IL-22 producing T cells and to target Vgamma2Vdelta2 T cells for balancing potentially hyper-activating IL-22-producing T cells in severe TB.


Conflict of interest statement

The authors have declared that no competing interests exist.

Figures

Figure 1
Figure 1. M. tuberculosis infection resulted in apparent increases in numbers of T cells capable of producing IL-22 without in vitro Ag re-stimulation, and drove distribution of these cells more dramatically in lungs than in blood and lymphoid tissues.
(A) Graphic data show percentage numbers of T cells capable of producing IL-22 or IL-17 de novo in the blood (left) and BAL fluid (right) during M. tuberculosis infection. The cells were directly measured by ICS in the presence of CD28/CD49d but without in vitro Ag stimulation. This would allow direct evaluation of regulatory effect by Vγ2Vδ2 T effector cells in the presence or absence of HMBPP. Data are mean percentage numbers in CD3 T cells with error bars of SEM derived from nine cynomolgus macaques. Data were gated on CD3 although most IL-22 cells were CD4 T cells (Fig. S1). This would allow direct comparisons with Vγ2Vδ2 T cells within CD3 T-cell population as shown in Figs. 3– 5. CD3+ T cells producing IL-22 or IL-17 in this and other figures included Vγ2Vδ2 T cells. The magnitude of increase in IL-22+ T cells in PBL (#) at weeks 4, 6 and 8 and in BAL fluid at week 8 were significantly greater than that in IL-17+ T cells (*) (P<0.005). # or *, P<0.05, **, P<0.01, ### or ***, P<0.001. (B) Bar graphic data show that appreciable numbers of IL-22-producing T cells directly measured in medium alone were comparable with those detected in medium plus CD28/CD49d mAbs or in medium plus CD3/CD28 mAbs. Data were mean ± SEM from PBMC obtained at necropsy (8 weeks after infection) from nine cynomolgus macaques. Similar data were seen at weeks 4 and 6 after M. tuberculosis infection. Data were gated on lymphocytes. (C) Representative flow-cytometry histograms of intracellular cytokine staining analysis show that IL-22- and IL-17-producing T cells appear to be two distinct cell populations. The percentage numbers of IL-22 (bottom, right), IL-17 (top, left) producing T cells and IL-22/IL-17 co-expressing T cells (top, right) in CD3 T cells are marked in the individual histograms. Data are CD3 gated. Similar data were repeatedly seen from at least 15 monkeys in blood (n = 21), BAL fluid (n = 21), lung (n = 15), spleen (n = 17), mesenteric lymph node (n = 20). (D) Bar graphic data show percentage numbers of T cells capable of producing IL-22 (left) and IL-17 (right) within CD3+ T cells in lymphocytes isolated from blood, BAL fluid, lungs, spleens and lymph nodes (LN) at 8 weeks after M. tuberculosis infection. Data are mean ± SEM derived from up to 16 macaques' lungs (n = 15, rhesus), spleens (n = 16, rhesus), mesenteric lymph nodes (n = 16, rhesus), blood (n = 9, cynomolgus), and BAL fluid (n = 9, cynomolgus). Data were measured by the ICS without antigen re-stimulation in the presence of medium plus CD28/CD49d mAb. Similar numbers of these cells were detected by the ICS in the presence of medium only (data not shown). Data were gated on CD3. *, P<0.05, **, P<0.01, ***, P<0.001. All rhesus macaques included for all the figures are Chinese rhesus macaques.
Figure 2
Figure 2. IL-22-producing T cells were detected in situ in lung TB granulomas from M. tuberculosis infected monkeys.
(A) Representative confocal microscopic images (63× numerical aperture) at the middle and bottom panels show CD3+IL-22+ T cells (marked by yellow arrows) in lung tissue sections prepared from the right middle lung lobes at 8 weeks after M. tuberculosis infection in rhesus monkeys. The images at the top panel show that no IL-22 (white arrows) was detectable in CD3 T cells in the peri-bronchiolar lymphoid lung section derived from healthy macaques that received BCG vaccination 4 years before. Bar: 5 um. (B) Confocal imaging analyses show percentage numbers of IL-22-producing T cells in the CD3+ T cells in right middle and caudal lung lobe tissues from infected rhesus macaques and undetectable numbers of these cells in lung sections from healthy BCG-vaccinated macaques. Shown are mean percentage numbers in CD3+ T cells calculated from three M. tuberculosis-infected macaques and three healthy BCG vaccinated controls (see Methods). IL-22-producing T cells and IL-22 negative CD3+ T cells were counted from at least 20 confocal-section images in each of six different tissue sections from each macaque; the data from three macaques were then calculated for means, SEM, and p values. No IL-22 staining with very low background-level fluorescence was observed when using control isotype IgG and the antibody non-reactive with tissue-sectioning IL-22 (Data not shown). (C) Representative single-color immunohistochemistry imaging (x400) shows that IL-22-producing T cells (brown) were distributed in granuloma from the right caudle lung lobe (infection site) of one infected rhesus macaque (animal RH 7734, right). Similar staining data were seen in the lung sections from other M. tuberculosis-infected macaques. No IL-22-producing T cells were detectable in lung tissues from healthy BCG vaccinated rhesus macaques (representative animal RH 27097, left). RH (Chinese rhesus macaque).
Figure 3
Figure 3. Phosphoantigen HMBPP activation of Vγ2Vδ2 T cells down-regulated the capability of T cells to actively produce IL-22 but not IL-17 de novo in lymphocytes from blood, lungs/BAL fluid, spleens and lymph nodes.
Cells from different compartments were either un-stimulated (CD28/CD49d) or stimulated with HMBPP (HMBPP plus CD28/CD49d), and then subjected to intracellular cytokine staining. Blood and BALF were taken at the endpoint matching necropsy schedule after M. tuberculosis infection. (A) Shown on the top panel are representative flow-cytometry histograms of intracellular cytokine staining analysis. The percentage numbers of IL-22-producing T cells in lymphocytes are marked above individual histograms. The bottom-panel flow-cytometry histograms show that HMBPP activation resulted in a reduction in numbers of T cells capable of producing IL-22. The numbers in parentheses denote folds of reduction (ratio of numbers of IL-22-producing T cells from unstimulated versus HMBPP stimulated measurements) after HMBPP treatment. Data were gated on CD3. The flow histograms were from representative M. tuberculosis-infected macaque CN7234 (blood), CN7222 (BAL fluid), RH7716 (lung), RH7717 (spleen) and RH7720 (mesenteric LN) respectively. CN (cynomolgus macaque). (B) Comparative analyses of IL-22-producing T cells in the presence and absence of HMBPP stimulation. Data are mean percentage numbers ± SEM derived from macaque animals' blood (n = 7, cynomolgus), BAL fluids (n = 5, cynomolgus), lungs (n = 7, rhesus), spleens (n = 11, rhesus) and mesenteric lymph nodes (n = 8, rhesus). *, P<0.05, **, P<0.01. Data were gated on CD3. (C) Bar graphic data show percentages (left) and folds (right) of down-regulation of IL-22-producing T cells after HMBPP stimulation. The fold of down-regulation was defined the same as above in Fig. 3A. The percentages of down-regulation were calculated by the formula [(Unstimulated–HMBPP-stimulated)/Unstimulated × 100%]. Results were shown as mean ± SEM. Data were gated on CD3. (D) Comparative analyses of IL-17-producing T cells in the presence and absence of HMBPP stimulation. Data are mean percentage numbers ± SEM derived from macaque animals' blood (n = 9, cynomolgus), BAL fluids (n = 9, cynomolgus), lungs (n = 15, rhesus), spleens (n = 16, rhesus) and mesenteric lymph nodes (n = 20, rhesus). Data were gated on CD3.
Figure 4
Figure 4. Up-regulation of IFNγ-producing Vγ2Vδ2 T effector cells after HMBPP stimulation coincided with the down-regulated capacity of T cells to produce IL-22 de novo.
(A) Representative paired flow-cytometry histograms from monkey RH7406 (lung), RH7720 (spleen), RH7357 (mesenteric lymph node) show intracellular cytokine staining data indicating that HMBPP stimulation up-regulated numbers of CD3+ IFNγ+Vγ2+ T cells (right) and down-regulated numbers of CD3+IL-22+ T cells (left) in lymphocytes from lungs, spleens and mesenteric lymph nodes (LN). Cells were gated on CD3. Percentage numbers of IL-22+ or IFNγ+Vγ2+ T cells in CD3 T cells are listed above individual histograms, and folds of up-regulation (the ratio of HMBPP-stimulated versus unstimulated) or down-regulation are indicated in parentheses. Note that 1 hour HMBPP stimulation did not increase the number of entire Vγ2Vδ2+ T cells (including both IFNγ+ and IFNγ- Vγ2Vδ2+ T-cell populations) in CD3+; the percentage of Vγ2Vδ2+ T cells in CD3+ remained similar in the presence or absence of HMBPP (HMBPP enabled some IFNγ- Vγ2Vδ2+ T cells to become IFNγ+ Vγ2Vδ2+ T cells). The decreased numbers of IL-22-producing T cells were not due to expansion of Vγ2Vδ2+ T cells after 1-hr HMBPP activation. (B) Comparative analyses of flow-cytometry data indicating that HMBPP stimulation up-regulated percentage numbers of IFNγ+Vγ2+ T cells (top panels) and down-regulated percentage numbers of IL-22+ CD3+ T cells (bottom) in lymphocytes from lungs (n = 6), spleens (n = 8) and mesenteric lymph nodes (n = 5). Data were means ± SEM derived from eight infected rhesus macaques and were gated on CD3. *, P<0.05, ***, P<0.001. (C) Comparative data indicating mean folds of up-regulation of CD3+IFNγ+Vγ2+ T cells (top) and down-regulation of CD3+IL-22+ T cells in lymphocytes from lungs (n = 6), spleens (n = 8) and mesenteric lymph nodes (n = 5). Data were derived from eight infected rhesus macaques and were gated on CD3.
Figure 5
Figure 5. Anti-IFNγ neutralizing Ab treatment reversed the HMBPP-mediated down-regulation effect on IL-22-producing T cells.
Cells from different anatomic compartments were either un-stimulated or stimulated with HMBPP, HMBPP + anti-IFNγ neutralizing Ab, or HMBPP + isotype matched IgG Ab, and then subjected to intracellular cytokine staining. (A) Representative flow-cytometry histograms from monkey RH7717 (lung), RH7719 (spleen) and RH7720 (mesenteric lymph node) show intracellular cytokine staining data demonstrating that anti-IFNγ neutralizing Ab but not isotype IgG reversed the HMBPP-mediated down-regulation of IL-22+CD3+ T cells in lymphocytes from lungs, spleens and mesenteric lymph nodes (LN). Cells were gated on CD3. Percentage numbers of CD3 T cells are listed above individual histograms. (B) Comparative flow-cytometry data show that anti-IFNγ Ab but not isotype IgG reversed the HMBPP-mediated down-regulation of IL-22+CD3+ T cells in lymphocytes from lungs, spleens and mesenteric lymph nodes (LN). Data were mean ± SEM derived from rhesus macaque animals' lungs (n = 7), spleens (n = 9) and mesenteric lymph nodes (n = 14). *, P<0.05, **, P<0.01. Addition of exogenous IFNγ to PBMC culture was not able to activate/expand Vγ2Vδ2 T cells or to down-regulate mature IL-22-producing T cells (data not shown).

Similar articles

Cited by

References

    1. Zenewicz LA, Yancopoulos GD, Valenzuela DM, Murphy AJ, Stevens S, et al. Innate and adaptive interleukin-22 protects mice from inflammatory bowel disease. Immunity. 2008;29:947–957. - PMC - PubMed
    1. Wolk K, Sabat R. Interleukin-22: a novel T- and NK-cell derived cytokine that regulates the biology of tissue cells. Cytokine Growth Factor Rev. 2006;17:367–380. - PubMed
    1. Zenewicz LA, Yancopoulos GD, Valenzuela DM, Murphy AJ, Karow M, et al. Interleukin-22 but not interleukin-17 provides protection to hepatocytes during acute liver inflammation. Immunity. 2007;27:647–659. - PMC - PubMed
    1. Wolk K, Kunz S, Witte E, Friedrich M, Asadullah K, et al. IL-22 increases the innate immunity of tissues. Immunity. 2004;21:241–254. - PubMed
    1. Liang SC, Tan XY, Luxenberg DP, Karim R, Dunussi-Joannopoulos K, et al. Interleukin (IL)-22 and IL-17 are coexpressed by Th17 cells and cooperatively enhance expression of antimicrobial peptides. J Exp Med. 2006;203:2271–2279. - PMC - PubMed

Publication types

MeSH terms