

The shifting demographic landscape of pandemic influenza
- PMID: 20195468
- PMCID: PMC2829076
- DOI: 10.1371/journal.pone.0009360
The shifting demographic landscape of pandemic influenza
Abstract
Background: As Pandemic (H1N1) 2009 influenza spreads around the globe, it strikes school-age children more often than adults. Although there is some evidence of pre-existing immunity among older adults, this alone may not explain the significant gap in age-specific infection rates.
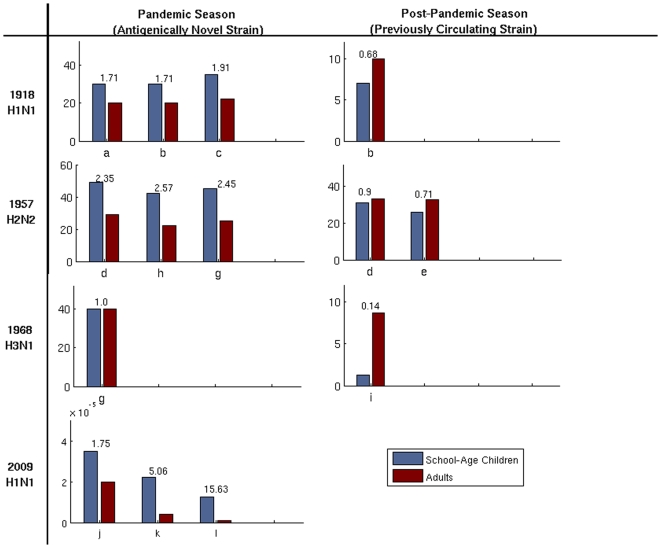
Methods and findings: Based on a retrospective analysis of pandemic strains of influenza from the last century, we show that school-age children typically experience the highest attack rates in primarily naive populations, with the burden shifting to adults during the subsequent season. Using a parsimonious network-based mathematical model which incorporates the changing distribution of contacts in the susceptible population, we demonstrate that new pandemic strains of influenza are expected to shift the epidemiological landscape in exactly this way.
Conclusions: Our analysis provides a simple demographic explanation for the age bias observed for H1N1/09 attack rates, and suggests that this bias may shift in coming months. These results have significant implications for the allocation of public health resources for H1N1/09 and future influenza pandemics.
Conflict of interest statement
Figures
 and
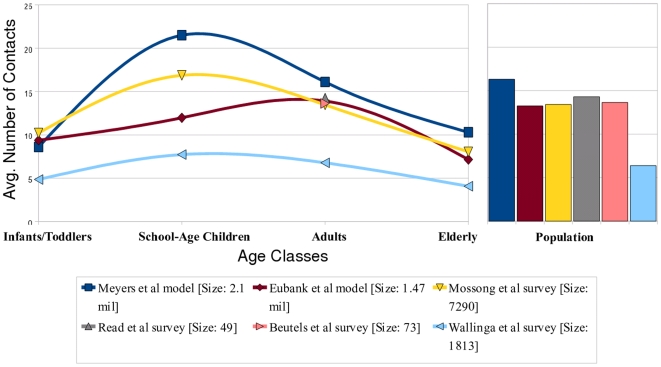
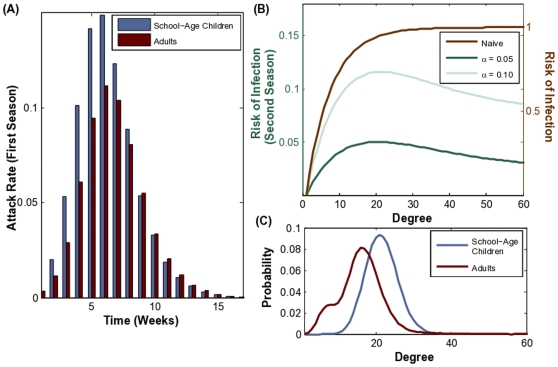
and  . (C) The degree distributions for school-age children (mean degree of 21.5) and adults (mean degree of 16.1) in our urban population network model. The bimodal adult degree distribution reflects heterogeneities in adult employment status.
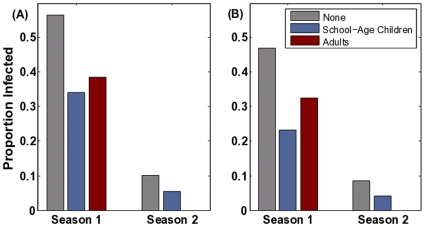
 (B) The impact of these policies assuming pre-existing resistance among adults (9%) and elderly (33%) acquired through exposure to a strain of the same subtype prior to 1956. The first season pathogen has a reproductive ratio of
  and the second season pathogen has an effective reproductive ratio of
  .
.Update of
-
The shifting demographic landscape of influenza.PLoS Curr. 2009 Oct 1;1:RRN1047. doi: 10.1371/currents.RRN1047. PLoS Curr. 2009. PMID: 20029616 Free PMC article.
References
-
- Chan M. Influenza A(H1N1): lessons learned and preparedness. 2009
-
- Centers for Disease Control and Prevention. 2009. CDC Estimates of 2009 H1N1 Influenza Cases, Hospitalizations and Deaths in the United States : Accessed Feb 5, 2010.
-
- Greenberg M, Lai M, Hartel G, Wichems C, Gittleson C. Response to a Monovalent 2009 Influenza A (H1N1) Vaccine. NEJM. 2009;361(25) - PubMed
-
- Centers for Disease Control and Prevention. Serum Cross-Reactive Antibody Response to a Novel Influenza A (H1N1) Virus After Vaccination with Seasonal Influenza Vaccine. Morb Mortal Wkly Rep. 2009;58:521–524. - PubMed
Publication types
MeSH terms
Substances
Grants and funding
LinkOut - more resources
Full Text Sources
Medical
Research Materials
Miscellaneous
