. 2010 Feb 26;5(2):e9365.
doi: 10.1371/journal.pone.0009365.

Differentiation of glioma and radiation injury in rats using in vitro produce magnetically labeled cytotoxic T-cells and MRI

Affiliations

Differentiation of glioma and radiation injury in rats using in vitro produce magnetically labeled cytotoxic T-cells and MRI

Ali S Arbab et al. PLoS One. .

Abstract

Background: A limitation with current imaging strategies of recurrent glioma undergoing radiotherapy is that tumor and radiation injury cannot be differentiated with post contrast CT or MRI, or with PET or other more complex parametric analyses of MRI data. We propose to address the imaging limitation building on emerging evidence indicating that effective therapy for recurrent glioma can be attained by sensitized T-cells following vaccination of primed dendritic cells (DCs). The purpose of this study was to determine whether cord blood T-cells can be sensitized against glioma cells (U-251) and if these sensitized cytotoxic T-cells (CTLs) can be used as cellular magnetic resonance imaging probes to identify and differentiate glioma from radiation necrosis in rodent models.

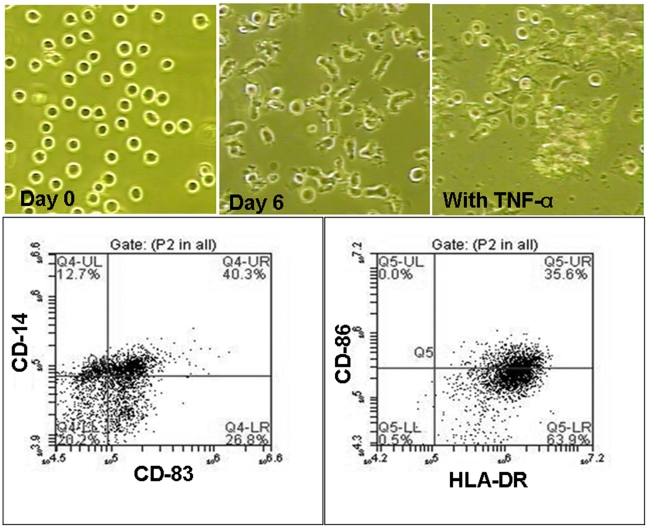
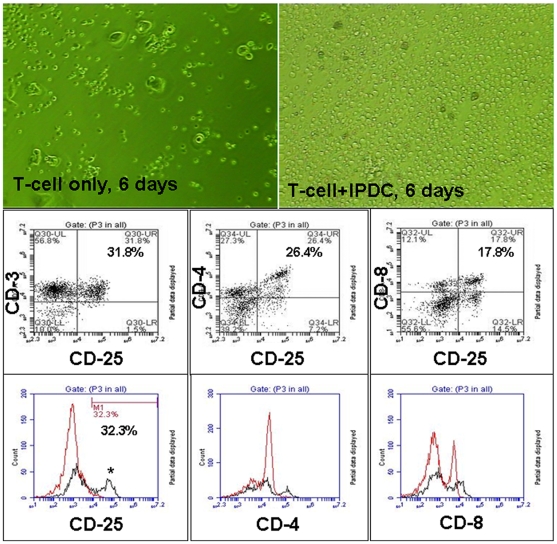
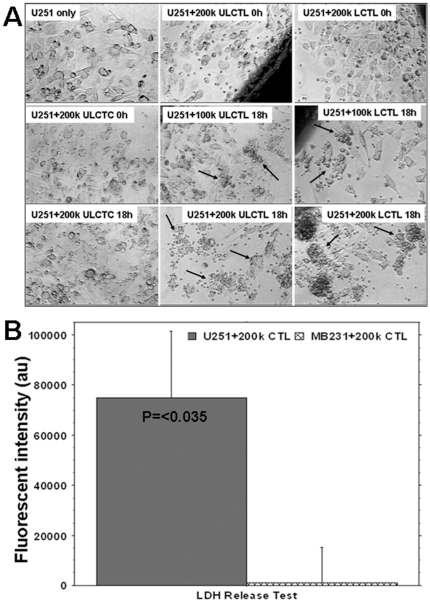
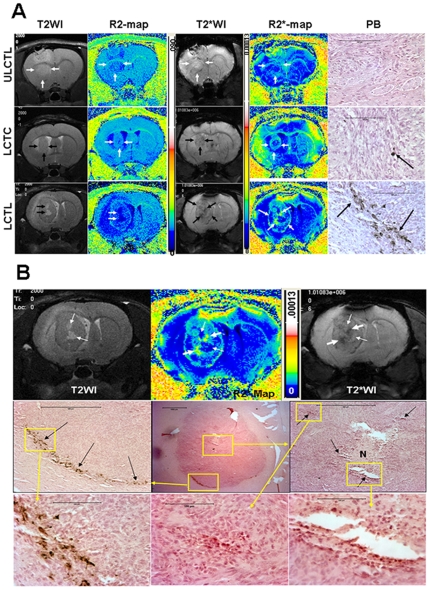
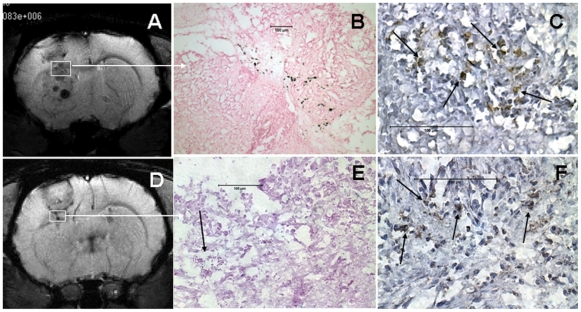
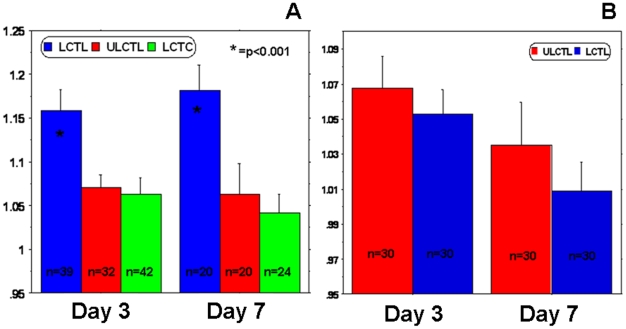
Methodology/principal findings: Cord blood T and CD14+ cells were collected. Isolated CD14+ cells were then converted to dendritic cells (DCs), primed with glioma cell lysate and used to sensitize T-cells. Phenotypical expression of the generated DCs were analyzed to determine the expression level of CD14, CD86, CD83 and HLA-DR. Cells positive for CD25, CD4, CD8 were determined in generated CTLs. Specificity of cytotoxicity of the generated CTLs was also determined by lactate dehydrogenase (LDH) release assay. Secondary proliferation capacity of magnetically labeled and unlabeled CTLs was also determined. Generated CTLs were magnetically labeled and intravenously injected into glioma bearing animals that underwent MRI on days 3 and 7 post- injection. CTLs were also administered to animals with focal radiation injury to determine whether these CTLs accumulated non-specifically to the injury sites. Multi-echo T2- and T2*-weighted images were acquired and R2 and R2* maps created. Our method produced functional, sensitized CTLs that specifically induced U251 cell death in vitro. Both labeled and unlabeled CTLs proliferated equally after the secondary stimulation. There were significantly higher CD25 positive cells (p = <0.006) in CTLs. In addition, T2- and T2*-weighted MR images showed increased low signal intensity areas in animals that received labeled CTLs as compared to the images from animals that received control cells. Histological analysis confirmed the presence of iron positive cells in sites corresponding to MRI low signal intensity regions. Significant differences (p = <0.001) in tumor R2 and R2* values were observed among the groups of animals. Animals with radiation injury exhibited neither MRI hypointense areas nor presence of iron positive cells.

Conclusion: Our results indicate that T-cells can be effectively sensitized by in vitro methods and used as cellular probes to identify and differentiate glioma from radiation necrosis.


Conflict of interest statement

Competing Interests: The authors have declared that no competing interests exist.

Figures

Figure 1
Figure 1. Making of mature dendritic cells from CD14+ cells.
Upper panel: Morphological changes in CD14+ cells following the addition of immature and mature dendritic cell (DC) media. Cells were grown in RPMI-1640 media containing 10% FBS, IL4 and GCSF; at day 8 TNF-α was also added. CD14+ cell morphology changed from the rounded cells to the cells exhibiting short dendrite-like processes. Mature DC attached to the growth surface. Lower panel: Multicolor flow cytometric dot plots of CD14+ cells-derived mature DCs at day 11 (3 days after adding TNF-α) indicate down regulation of CD14 and up regulation of CD86, CD83 and HLA-DR after DCs maturation.
Figure 2
Figure 2. Morphological and phenotypical changes in T-cells during sensitization.
Upper panel: Culture of cord blood derived T-cells in the absence (left) or presence (right) of U251 cell lysate primed irradiated DC (PIDC). T-cells were cultured in RPMI-1640 media containing 10% FBS and IL-2 for 6 days. Note the number and morphology of the sensitized T-cells (right). Middle panel: Dot plot analysis of flow cytometric data of the CTLs showing activated T-cells (CD25) that are also both CD4 and CD8 positive. Lower panel: Flow-cytometric analysis (histogram plot) of T-cells cultured in the absence (red line) and presence (black line) of PIDC for day 6. Note the higher number of CD4+, CD8+ and CD25+ T-cells on day 6. There were a significantly (p = 0.006) higher number of activated T-cells on day 6 in the presence of PIDC.
Figure 3
Figure 3. Specificity of labeled and unlabeled cytotoxic T-cells (LCTLs and ULCTLs, respectively) in vitro.
Figure 3A: U251 cells (100k) were plated in 24-well plates and grown until 90% confluent. Then unlabeled control T-cells (ULCTCs), LCTLs or ULCTLs were added to the cultures (100k and 200k per well). The migration and specific accumulation of T-cells around the tumor cells were microphotographed at 0h and 18h of co-culture. Left column: Morphology of U251 alone and after incubation with 200k of CTC at 0 and 18 hours. There is no change in the morphology of U251 and CTC seems to be sitting on the tumor cells even after 18 hours of incubation. Middle column: Morphology of U251 cells at 0 and 18 hours after incubation with ULCTL. The ULCTLs seem to be sitting on the tumor cells at 0 hour. The specific accumulation of ULCTLs around the tumor cells (arrows) was seen after 18 hours for both 100k and 200k ULCTLs conditions. Compared to the morphology of U251 cells at 0 hour, the dramatic changes in the morphology of U251 cells were observed. Cells become elongated and sparse. This phenomena was more pronounced at higher density (i.e. 200k) of ULCTLs. Right column: Similar to ULCTLs, LCTLs also show similar phenomena of specific accumulation around the tumor cells (arrows) and changes in the morphology of U251 cells. Figure 3B: Both U251 (100k) and human breast cancer cells (MBA-MD-231, 100k) were incubated in their respective media (1 ml in 24-well plate) in the presence or absence of 200k CTLs overnight. On the next day, supernatants from all the conditions were collected and the lactate dehydrogenase (LDH) contents were determined. Average fluorescent values detected in the supernatant of U251 and MBA-MD-231 cultures without CTLs were deducted from the fluorescent values detected in the corresponding cell lines in the presence of CTLs. The data are expressed as mean ± SEM. Significantly higher (p = <0.017) LDH activity was observed in U251 culture in the presence of CTLs indicating specificity of the sensitized T-cells.
Figure 4
Figure 4. MRI and Prussian blue positive cells in tumors.
Figure 4A: T2-weighted and T2*-weighted images and their corresponding R2 and R2* maps and DAB enhanced Prussian blue staining from representative animals that received unlabeled CTL (ULCTL, upper row), labeled control T-cells (LCTC, middle row) and CTL (LCTL, lower row). Both T2W and T2*W images show well established tumors in the brain, however, low signal intensity areas were only seen in tumors that received LCTC and LCTL. Corresponding R2* maps show high signal intensity areas. Animals that received LCTL show high signal intensity areas both at the peripheral and central part of the tumors (arrows). Corresponding DAB enhanced Prussian blues staining show multiple Prussian blue positive cells in tumors that received LCTL (arrows). There are a few Prussian blue positive cells seen in tumor that received LCTC (arrow). No definite Prussian blue positive cells were seen in tumor that received ULCTL. Areas of necrosis can easily be identified by comparing T2WI and R2 maps (thick arrows) in tumor that received LCTL (lower row). Bars on the images measure 100 µm. Figure 4B: Detailed histological analysis of the tumor that received LCTL. Bars on the images measure 100 µm. Upper panel: T2-weighted image (T2WI) and T2*-weighted image (T2*WI) show areas of necrosis (high signal intensity on T2WI and T2*WI and low signal intensity on R2* map). Thin arrows show the sites of necrosis and thick arrows show possible site of accumulated iron positive cells. Middle panel: Representative histological section with similar tumor orientation (within the constraints of the experimental limitations, i.e. 1 mm thick MRI slices versus 10 µ thick histological section) show central necrosis (N) in the tumor with areas of iron positive cells (black arrows) seen in the central and peripheral part of the tumor that received iron labeled CTLs. Lower panel: Enlarged view of the boxed areas.
Figure 5
Figure 5. MRI and activated T-cells in tumors.
Representative cases of animals that received labeled CTL (A-C) and unlabeled CTL (D-F). (A) T2*-weighted images (T2*WI) showed low signal intensity areas all over the tumors (both periphery and center). (B) DAB enhanced Prussian blue staining showed multiple Prussian blue positive cells corresponding to boxed area (brown spots). (C) Multiple CD45RO positive cells (arrows, activated T-cells) were seen at the corresponding area. (D) T2*WI showed well developed tumor with areas of low signal intensity at the periphery. There were no Prussian blue positive cells seen at the corresponding areas (E), however, multiple hemorrhagic areas were observed (arrow on E). (F) Multiple CD45RO positive cells seen in the tumor. Scale bar  = 100 µm.
Figure 6
Figure 6. MRI and histology in radiation injury.
Representative magnetic resonance imaging and corresponding histochemical analysis of radiation injured (8 weeks after 50Gy focal irradiation) animal that received labeled CTL. (A) T2*-weighted image showed no definite low signal intensity area at the site of radiation injury (arrow) compared to contralateral hemisphere. (B) Corresponding R2* map also showed no high signal intensity area. Luxol fast blue staining revealed extensive loss of myelination at the site of radiation injury (C) compared to that at the corresponding site of contralateral normal hemisphere (D). FITC-tagged tomato lectin staining showed loss of normal blood vessels morphology with evidence of dilatation (arrows) at the corresponding site of radiation injury (demyelinated area) (E), in contrast to the vessel distribution seen in the corresponding site of the contralateral normal hemisphere (F). DAB enhanced Prussian blue staining showed no Prussian blue positive cells at the corresponding radiation injured or contralateral normal hemispheres (G and H). Luxol fast blue, lectin and Prussian blue stained tissues sections were obtained from consecutive slices.
Figure 7
Figure 7. Relaxation parameters in tumors and radiation injuries.
(A) Analyses of R2* values normalized to contralateral normal hemisphere (indirect indicator of the accumulation of iron positive cells) showed significantly higher (P = <0.001) accumulation of iron positive cells in tumor that received labeled CTLs. The number of accumulated cells was higher at both, days 3 and 7. n represents the number of sections containing tumors in at least 5 animals. (B) Similar analyses of R2* values normalized to contralateral normal hemisphere showed no difference between the groups of animals that received labeled and unlabeled CTLs. n represents the number of sections included in the analyses from 6 animals (5 sections from each animal, at the level of bregma, 2 sections front and 2 sections behind).

References

    1. Remer S, Murphy ME. The challenges of long-term treatment outcomes in adults with malignant gliomas. Clin J Oncol Nurs. 2004;8:368–376. - PubMed
    1. Iwama T, Yamada H, Sakai N, Andoh T, Nakashima T, et al. Correlation between magnetic resonance imaging and histopathology of intracranial glioma. Neurol Res. 1991;13:48–54. - PubMed
    1. Watanabe M, Tanaka R, Takeda N. Magnetic resonance imaging and histopathology of cerebral gliomas. Neuroradiology. 1992;34:463–469. - PubMed
    1. Dhermain F, Ducreux D, Bidault F, Bruna A, Parker F, et al. [Use of the functional imaging modalities in radiation therapy treatment planning in patients with glioblastoma]. Bull Cancer. 2005;92:333–342. - PubMed
    1. Chang SM, Butowski NA, Sneed PK, Garner IV. Standard treatment and experimental targeted drug therapy for recurrent glioblastoma multiforme. Neurosurg Focus. 2006;20:E4. - PubMed

Publication types

MeSH terms