. 2010 Feb 26;5(2):e9447.
doi: 10.1371/journal.pone.0009447.

Local membrane deformations activate Ca2+-dependent K+ and anionic currents in intact human red blood cells

Affiliations

Local membrane deformations activate Ca2+-dependent K+ and anionic currents in intact human red blood cells

Agnieszka Dyrda et al. PLoS One. .

Abstract

Background: The mechanical, rheological and shape properties of red blood cells are determined by their cortical cytoskeleton, evolutionarily optimized to provide the dynamic deformability required for flow through capillaries much narrower than the cell's diameter. The shear stress induced by such flow, as well as the local membrane deformations generated in certain pathological conditions, such as sickle cell anemia, have been shown to increase membrane permeability, based largely on experimentation with red cell suspensions. We attempted here the first measurements of membrane currents activated by a local and controlled membrane deformation in single red blood cells under on-cell patch clamp to define the nature of the stretch-activated currents.

Methodology/principal findings: The cell-attached configuration of the patch-clamp technique was used to allow recordings of single channel activity in intact red blood cells. Gigaohm seal formation was obtained with and without membrane deformation. Deformation was induced by the application of a negative pressure pulse of 10 mmHg for less than 5 s. Currents were only detected when the membrane was seen domed under negative pressure within the patch-pipette. K(+) and Cl(-) currents were strictly dependent on the presence of Ca(2+). The Ca(2+)-dependent currents were transient, with typical decay half-times of about 5-10 min, suggesting the spontaneous inactivation of a stretch-activated Ca(2+) permeability (PCa). These results indicate that local membrane deformations can transiently activate a Ca(2+) permeability pathway leading to increased [Ca(2+)](i), secondary activation of Ca(2+)-sensitive K(+) channels (Gardos channel, IK1, KCa3.1), and hyperpolarization-induced anion currents.

Conclusions/significance: The stretch-activated transient PCa observed here under local membrane deformation is a likely contributor to the Ca(2+)-mediated effects observed during the normal aging process of red blood cells, and to the increased Ca(2+) content of red cells in certain hereditary anemias such as thalassemia and sickle cell anemia.


Conflict of interest statement

Competing Interests: The authors have declared that no competing interests exist.

Figures

Figure 1
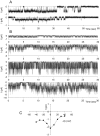
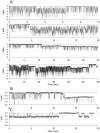
Figure 1. Evidence for spontaneous channel activity following seal formation.
Patch-clamp single-channel recordings of red blood cell spontaneous membrane electrical activity (i.e. in absence of pipette potential: -Vp = 0 mV) indicating an inwardly directed movement of cations or an outward movement of anions during the first 10 min following seal formation. Seals were obtained by underpressure inducing membrane deformation in the patch pipette. Panel A shows two typical recordings obtained with solution A (150 mM NaCl, pCa3) in the pipette and bathing solutions. Long channel openings are followed by long silent intervals. (B) shows four different recordings, obtained with solution B (150 mM KCl, pCa3) in the pipette solution and solution A (150 mM NaCl, pCa 3) in bathing solution. Dashed lines indicate the baseline corresponding to the closed state. Panel C presents an example of I/V plot obtained when 1 min ramps of depolarizng or hyperpolarizing voltages were imposed in the pipette in the following order: (in mV) 0, −10, +10, −20, +20, −30, +30, −40, +40, immediately following seal formation. This V-shaped I/V curve suggests a continuous decline with time in channel activity.
Figure 2
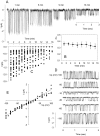
Figure 2. Transient nature of recorded currents.
Panel A provides an example (representative of 50 patches) of progressive decline of a large channel activity recorded at different times after seal formation with solution B (150 mM KCl, pCa3) in the pipette solution and solution A (150 mM NaCl, pCa3) in bathing solution at 0 mV pipette potential. Panel B displays the corresponding mean (n = 8) evolution of the open probability (Po) calculated from recordings displaying only one channel. Panel C summarizes the evolution of currents recorded from 35 separate patches during the first 16 min. Once the current was stable in the range 0.3–0.5 pA, the currents obtained by evoking a series of test potentials from −100 to +100 mV for 15 sec from a holding potential of 0 mV were recorded as shown in the example of Panel D and the corresponding I/V pairs were collected in the I/V plot displayed in Panel E (127 points from 14 experiments).
Figure 3
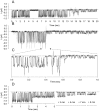
Figure 3. Patterns of channel activity decline.
Three fast modalities of current transitions could be discerned during activity decline: Panel A (representative of 6 recordings), fast (3 sec) but progressive transition from a large current (1.4 pA in the present example) to a stable 0.3–0.5 pA current; Panel B and C (representative of 12 recordings), instantaneous transition from large (1.8 pA in the present example) to a stable 0.3–0.5 pA current; Panel D (representative of 9 recordings), instantaneous transition from a large (1.7 pA in the present example) to an intermediary current (0.9 pA) which thereafter followed progressive decline to a stable 0.3–0.5 pA current. In all cases recordings were obtained with solution A (150 mM NaCl, pCa3) in the bathing solutions and solution B (150 mM KCl, pCa3) in the patch pipettes.
Figure 4
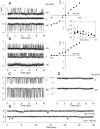
Figure 4. Identification of Gardos channels.
(A and B) Patch-clamp single-channel recordings (representative of 25 and 19 experiments, respectively) and corresponding I/V relationships of red blood cell membrane electrical activity obtained (A) with solution B (150 mM KCl, pCa3) in the pipette and solution B in bath, and (B) with solution B in bath and solution A (150 mM NaCl, pCa3) in the pipette. The inset displays the corresponding evolution of the open probabilities (Po)(Closed symbols: panel A; open symbols: panel B). Panels C and D show, at 0 mV and −40 mV pipette potentials, inhibition of channel activity by clotrimazole (C: control; D: clotrimazole added to the bathing solution at a concentration of 10 µmol/l)(representative of 8 experiments). Requirement of extracellular calcium for activation of Gardos channels is demonstrated in Panel E (representative of 11 experiments) by almost total absence of channel activity whatever the imposed pipette potential (0 mV and −40 mV in the presented recordings) when the bathing solution was solution A (150 mM NaCl) adjusted to pCa7 and pipettes contained solution B (150 mM KCl) adjusted to pCa7.
Figure 5
Figure 5. Effect of plasma membrane calcium pump (PMCA) inhibition on current amplitude as a function of time.
Added to the bathing solution 2–3 min before seal formation, vanadate (1 mM) did not modify the initial diversity of current amplitudes, but the declining pattern persisted albeit at a significantly reduced rate. Following seal formation, none of the 25 patches of this series of experiments ceased electrical activity during the first 16 minutes.
Figure 6
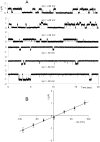
Figure 6. Evidence for anionic channel activation (a).
Patch-clamp single-channel recordings of red blood cell membrane electrical activity obtained during the first 10 min following seal formation in absence of pipette potential (Vp = 0 mV). (A) shows four different recordings, obtained with solution B (150 mM KCl, pCa3) in the pipette and solution A (150 mM NaCl, pCa3) in bath. The sudden shifts of the baseline underlying the K+ channel current reflects the onset of an additional type of channel activity. Panel B presents a sample of recording where the Gardos channel and an anionic channel are present simultaneously and the recording displayed in C (representative of 12 experiments) shows, on the same patch, that after inhibition of Gardos channel activity by clotrimazole, added in the bathing solution at the concentration of 10 µmol/l, the remaining anionic activity was characterized by long openings followed by long closure intervals.
Figure 7
Figure 7. Evidence for anionic channel activation (b).
An example of patch-clamp single-channel recordings obtained during the first 10 min following seal formation at at different membrane potentials (Panel A), with solution A (150 mM NaCl, pCa3) in the pipette and bathing solutions, and corresponding I/V relationship (Panel B). Points are means ± SEM obtained from 6 experiments.
Figure 8
Figure 8. Diagrammatic representation of hypothesized time course of changes in total cell calcium.
Upon membrane deformation, calcium enters the cell via PCa driven by a steep inward Ca2+ gradient. A new pump-leak balance is generated with elevated [Ca2+]i initially set at an arbitrary maximal level of total calcium content (1.0 arbitrary unit). As PCa declines with time, the changing pump-leak balance is with a time-declining pattern in total cell calcium. PMCA V max declines with RBC age, so that the time course of Ca2+ extrusion will be faster in young cells (curve 1) than in old or pump-inhibited cells (curve 2). Dashed line (a) represents the threshold of Gardos channel activation. Dashed line (b) represents the calcium level above which Gardos channel remains Ca2+-saturated with maximal activity (maximal Po). During the process of Ca2+ extrusion with declining PCa, the time spent between levels (b) and (a) varies with cell age. During the intervals Δt1 and Δt2 the open state probability of the Gardos channels declines progressively to extinction following Ca2+ desaturation.
Figure 9
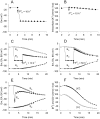
Figure 9. Analysis of the homeostasis of a red blood cell under cell-attached patch clamp with the use of the Lew-Bookchin model.
The predicted effects of sudden and maximal Gardos channel activation on the membrane potential Em and intracellular K+ concentration ([K+]) are presented in panels A and B. Electrodiffusional permeability for K+ ions (PG K) was increased to a value of 10 h−1 at time t = 2 min. The parameter values chosen for this simulation were 5 mM KCl and 150 mM NaCl in external bathing solution. The initial PG K value was 0.001651 h−1; for other steady state default parameters refer to Lew and Bookchin . Panels C and D present the simulated effects on Em, EK (equilibrium potential for K+ ions) and EA (equilibrium potential for anions) of sudden and maximal Gardos channel activation (as above) followed by sudden activation of anionic electrodiffusional permeability (PG A). At time t = 7 min, PG A was changed from 1.2 h−1 to 10 h−1 (C) or 50 h−1 (D) corresponding to moderate and large activations. To simulate the effects of a gradual increase in anionic electrodiffusional permeability (panel E), PG A was changed from 1.2 h−1 to 5 h−1 at t = 3 and incremented by 5 h−1 each min to reach PG A = 35 h−1 at t = 18 min). Panel F displays the corresponding evolution of intracellular K+ and A concentrations.
Figure 10
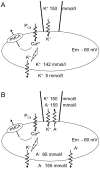
Figure 10. Diagrammatic representation of the currents and transporters involved in the deformation-induced transient response.
Panel (A). Upon membrane deformation, calcium enters the cell driven by a steep inward gradient; the consequent elevated [Ca2+]i activates Ca2+-sensitive K+ channels. The resulting hyperpolarization increases the driving force for inward movement of K+ ions from the high-K+ pipette solution to the cell interior. Because the three compartments, extracellular medium, cell interior and patch pipette are in series, with low-K+ in the extracellular compartment the K+ fluxes are oriented from the pipette to the cell and from the cell to the extracellular compartment. Elevated [Ca2+]i at the inner membrane surface stimulates uphill Ca2+ extrusion through the PMCA. Panel (B). Hyperpolarization also sets the driving force for net anion (A) loss through electrodiffusional pathways. The small chemical gradient which exists between the bath/pipette (155 mM) and the cell interior (95 mM) is largely offset by Gardos channel-mediated hyperpolarization, resulting in outward movement of anions both at pipette and whole cell levels.

References

    1. Egee S, Lapaix F, Decherf G, Staines HM, Ellory JC, et al. A stretch-activated anion channel is up-regulated by the malaria parasite Plasmodium falciparum. J Physiol. 2002;542:795–801. - PMC - PubMed
    1. Bouyer G, Egee S, Thomas SL. Three types of spontaneously active anionic channels in malaria-infected human red blood cells. Blood Cells Mol Dis. 2006;36:248–254. - PubMed
    1. Bouyer G, Egee S, Thomas SL. Toward a unifying model of malaria-induced channel activity. Proc Natl Acad Sci U S A. 2007;104:11044–11049. - PMC - PubMed
    1. Decherf G, Egee S, Staines HM, Ellory JC, Thomas SL. Anionic channels in malaria-infected human red blood cells. Blood Cells Mol Dis. 2004;32:366–371. - PubMed
    1. Decherf G, Bouyer G, Egee S, Thomas SL. Chloride channels in normal and cystic fibrosis human erythrocyte membrane. Blood Cells Mol Dis. 2007;39:24–34. - PubMed

Publication types