Sod2 haploinsufficiency does not accelerate aging of telomere dysfunctional mice
- PMID: 20195488
- PMCID: PMC2830048
- DOI: 10.18632/aging.100030
Sod2 haploinsufficiency does not accelerate aging of telomere dysfunctional mice
Erratum in
-
Correction for: Sod2 haploinsufficiency does not accelerate aging of telomere dysfunctional mice.Aging (Albany NY). 2019 Dec 6;11(23):11793-11794. doi: 10.18632/aging.102602. Epub 2019 Dec 6. Aging (Albany NY). 2019. PMID: 31879376 Free PMC article. No abstract available.
Abstract
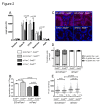
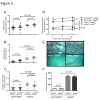
Telomere shortening represents a causal factor of cellular senescence. At the same time, several lines of evidence indicate a pivotal role of oxidative DNA damage for the aging process in vivo. A causal connection between the two observations was suggested by experiments showing accelerated telomere shorting under conditions of oxidative stress in cultured cells, but has never been studied in vivo. We therefore have analysed whether an increase in mitochondrial derived oxidative stress in response to heterozygous deletion of superoxide dismutase (Sod2(+/-)) would exacerbate aging phenotypes in telomere dysfunctional (mTerc(-/-)) mice. Heterozygous deletion of Sod2 resulted in reduced SOD2 protein levels and increased oxidative stress in aging telomere dysfunctional mice, but this did not lead to an increase in basal levels of oxidative nuclear DNA damage, an accumulation of nuclear DNA breaks, or an increased rate of telomere shortening in the mice. Moreover, heterozygous deletion of Sod2 did not accelerate the depletion of stem cells and the impairment in organ maintenance in aging mTerc(-/-) mice. In agreement with these observations, Sod2 haploinsufficiency did not lead to a further reduction in lifespan of mTerc(-/-) mice. Together, these results indicate that a decrease in SOD2-dependent antioxidant defence does not exacerbate aging in the context of telomere dysfunction.
Keywords: DNA damage; SOD2; aging; free radicals; oxidative stress; stem cells; superoxide; telomere shortening.
Conflict of interest statement
The authors have no conflict of interests to declare.
Figures


Similar articles
-
Antioxidant therapy attenuates myocardial telomerase activity reduction in superoxide dismutase-deficient mice.J Mol Cell Cardiol. 2011 Apr;50(4):670-7. doi: 10.1016/j.yjmcc.2010.12.014. Epub 2010 Dec 30. J Mol Cell Cardiol. 2011. PMID: 21195081
-
Life-long reduction in MnSOD activity results in increased DNA damage and higher incidence of cancer but does not accelerate aging.Physiol Genomics. 2003 Dec 16;16(1):29-37. doi: 10.1152/physiolgenomics.00122.2003. Physiol Genomics. 2003. PMID: 14679299
-
Alterations in mitochondrial function, hydrogen peroxide release and oxidative damage in mouse hind-limb skeletal muscle during aging.Mech Ageing Dev. 2006 Mar;127(3):298-306. doi: 10.1016/j.mad.2005.11.004. Epub 2006 Jan 6. Mech Ageing Dev. 2006. PMID: 16405961
-
Role of telomere dysfunction in aging and its detection by biomarkers.J Mol Med (Berl). 2009 Dec;87(12):1165-71. doi: 10.1007/s00109-009-0509-5. Epub 2009 Aug 8. J Mol Med (Berl). 2009. PMID: 19669107 Review.
-
Telomere shortening is a sole mechanism of aging in mammals.Curr Aging Sci. 2012 Dec;5(3):203-8. doi: 10.2174/1874609811205030006. Curr Aging Sci. 2012. PMID: 23387887 Review.
Cited by
-
The role of manganese superoxide dismutase in skin aging.Dermatoendocrinol. 2012 Jul 1;4(3):232-5. doi: 10.4161/derm.21819. Dermatoendocrinol. 2012. PMID: 23467724 Free PMC article.
-
Mitochondrial hormesis and diabetic complications.Diabetes. 2015 Mar;64(3):663-72. doi: 10.2337/db14-0874. Diabetes. 2015. PMID: 25713188 Free PMC article. Review.
-
Activating the PGC-1α/TERT Pathway by Catalpol Ameliorates Atherosclerosis via Modulating ROS Production, DNA Damage, and Telomere Function: Implications on Mitochondria and Telomere Link.Oxid Med Cell Longev. 2018 Jun 25;2018:2876350. doi: 10.1155/2018/2876350. eCollection 2018. Oxid Med Cell Longev. 2018. PMID: 30046372 Free PMC article.
-
Exploring juventology: unlocking the secrets of youthspan and longevity programs.Front Aging. 2024 Apr 4;5:1379289. doi: 10.3389/fragi.2024.1379289. eCollection 2024. Front Aging. 2024. PMID: 38638872 Free PMC article. Review.
-
Telomere-mediated chromosomal instability triggers TLR4 induced inflammation and death in mice.PLoS One. 2010 Jul 29;5(7):e11873. doi: 10.1371/journal.pone.0011873. PLoS One. 2010. PMID: 20686699 Free PMC article.
References
-
- Harman D. Aging: a theory based on free radical and radiation chemistry. Journal of Gerontology. 1956;11:298–300. - PubMed
-
- Cadenas E. Mitochondrial free radical production and cell signaling. Molecular Aspects of Medicine. 2004;25:17–26. - PubMed
-
- Fabrizio P, Pletcher SD, Minois N, Vaupel JW, Longo VD. Chronological aging-independent replicative life span regulation by Msn2/Msn4 and Sod2 in Saccharomyces cerevisiae. FEBS Letters. 2004;557:136–142. - PubMed
Publication types
MeSH terms
Substances
LinkOut - more resources
Full Text Sources
Medical
