

Molecular predictors of 3D morphogenesis by breast cancer cell lines in 3D culture
- PMID: 20195492
- PMCID: PMC2829039
- DOI: 10.1371/journal.pcbi.1000684
Molecular predictors of 3D morphogenesis by breast cancer cell lines in 3D culture
Abstract
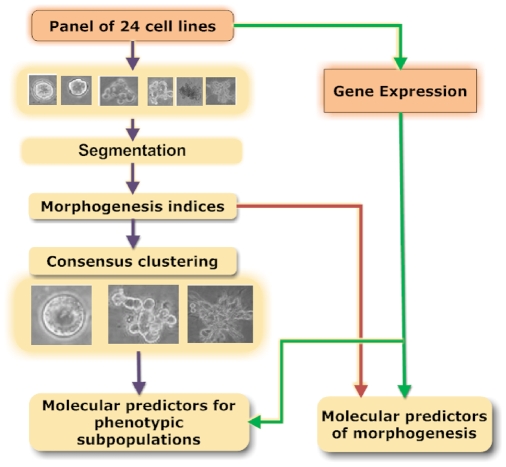
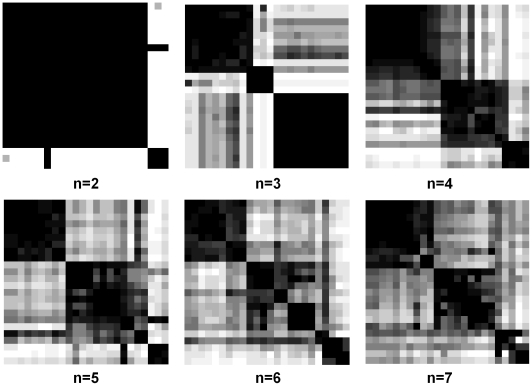
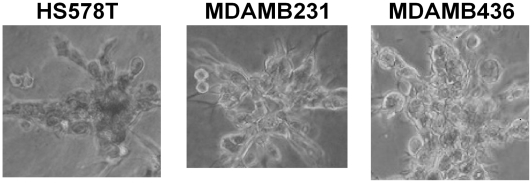
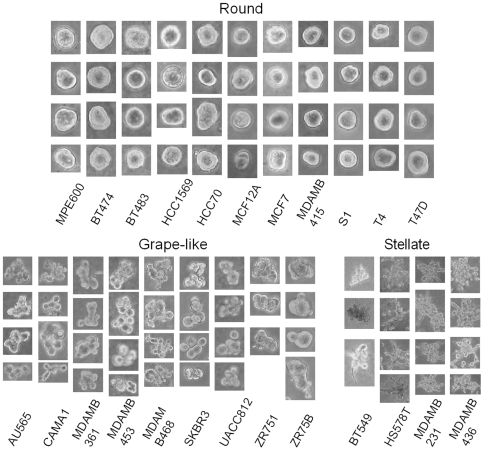
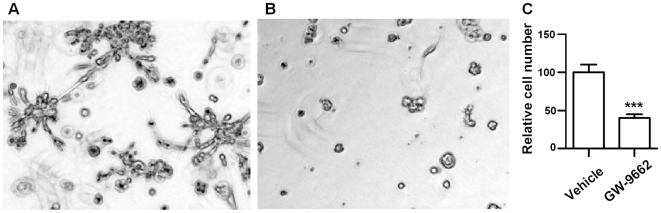
Correlative analysis of molecular markers with phenotypic signatures is the simplest model for hypothesis generation. In this paper, a panel of 24 breast cell lines was grown in 3D culture, their morphology was imaged through phase contrast microscopy, and computational methods were developed to segment and represent each colony at multiple dimensions. Subsequently, subpopulations from these morphological responses were identified through consensus clustering to reveal three clusters of round, grape-like, and stellate phenotypes. In some cases, cell lines with particular pathobiological phenotypes clustered together (e.g., ERBB2 amplified cell lines sharing the same morphometric properties as the grape-like phenotype). Next, associations with molecular features were realized through (i) differential analysis within each morphological cluster, and (ii) regression analysis across the entire panel of cell lines. In both cases, the dominant genes that are predictive of the morphological signatures were identified. Specifically, PPARgamma has been associated with the invasive stellate morphological phenotype, which corresponds to triple-negative pathobiology. PPARgamma has been validated through two supporting biological assays.
Conflict of interest statement
The authors have declared that no competing interests exist.
Figures
 has been partitioned into two blocks for
  ; however, the order is not preserved.
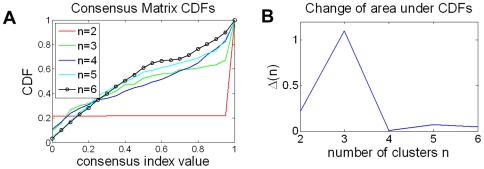
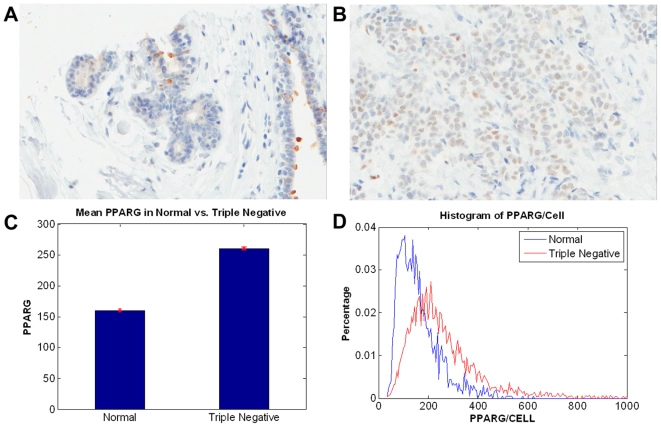
 in normal and triple negative of human mammary tissue sections indicates that (i) in normal tissue, localization is apical and unbound to the nuclear regions, and (ii) in triple negative tissue, localization is nuclear-bound and heterogeneous. (C–D) Quantitative analysis on a cell-by-cell basis indicates that PPAR
 (i) is upregulated in triple negative patients, and (ii) has a heterogeneous distribution.
References
-
- Sharan R, Elkon R, Shamir R. Clustering analysis and its applications to gene expression data. Ernst Schering Res Found Workshop. 2002;38:83–108. - PubMed
-
- Hartigan J. Clustering algorithms. Wiley; 1975.
-
- Cheng Y, Church G. Biclustering of expression data. Proc Int Conf Intell Syst Mol Biol. 2000:93–103. - PubMed
-
- Tanay A, Sharan R, Shamir R. Discovering statistically significant biclusters in gene expression data. Bioinformatics. 2002;18:136–144. - PubMed
-
- Yamanishi Y, Vert J, Kanehisa M. Extraction of correlated gene clusters from multiple genomic data by generalized kernel canonical correlation analysis. Bioinformatics. 2003;19:323–330. - PubMed
Publication types
MeSH terms
Substances
Grants and funding
LinkOut - more resources
Full Text Sources
Medical
Research Materials
Miscellaneous
