

Interpreting metabolomic profiles using unbiased pathway models
- PMID: 20195502
- PMCID: PMC2829050
- DOI: 10.1371/journal.pcbi.1000692
Interpreting metabolomic profiles using unbiased pathway models
Abstract
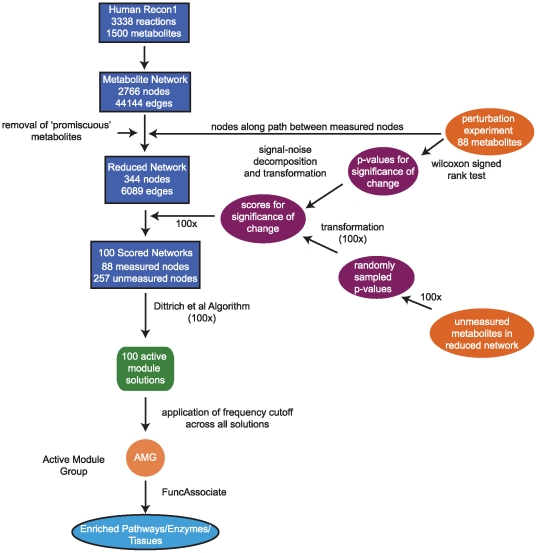
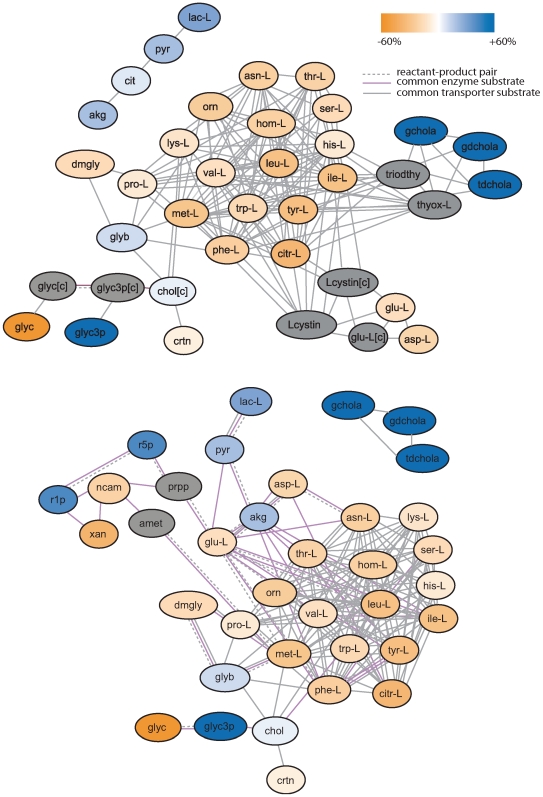
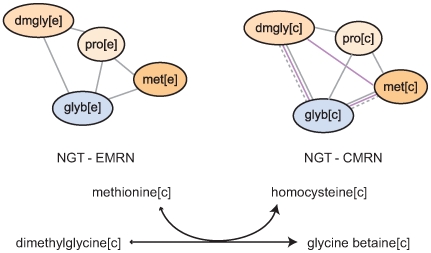
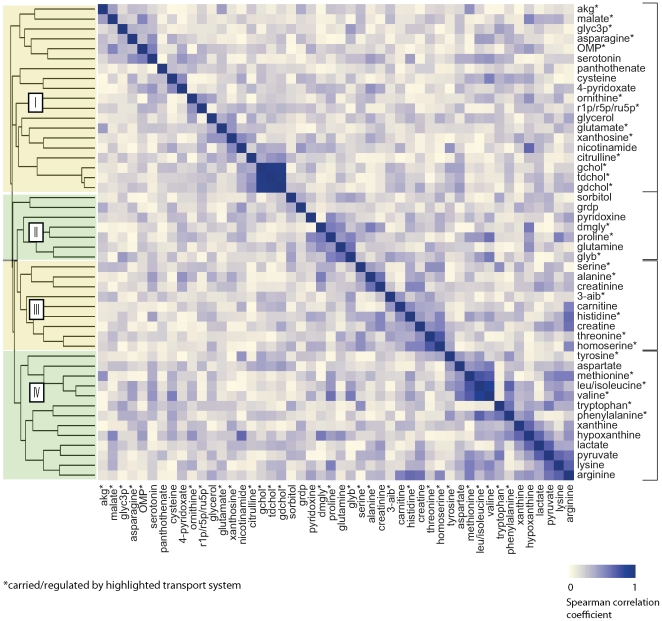
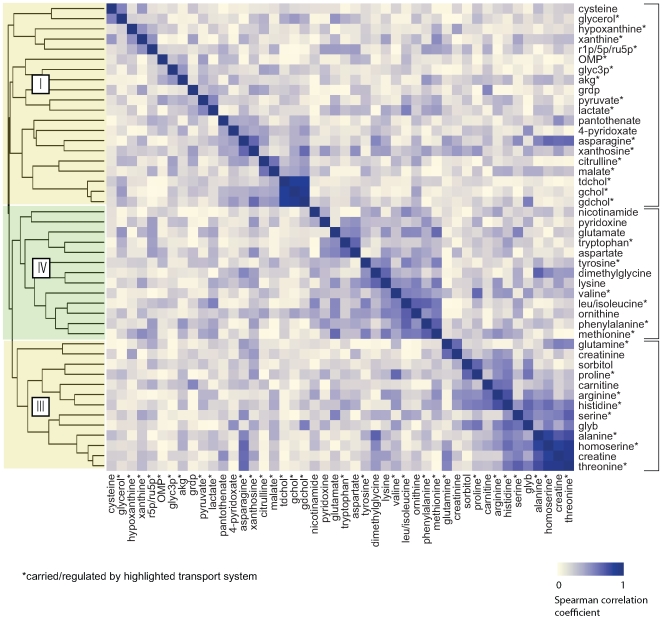
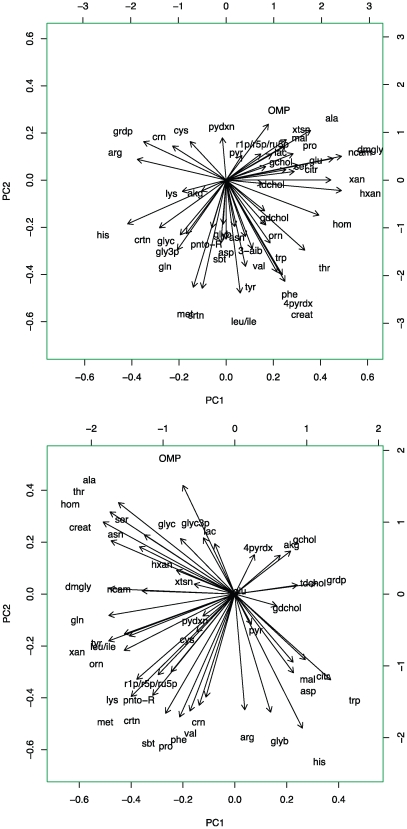
Human disease is heterogeneous, with similar disease phenotypes resulting from distinct combinations of genetic and environmental factors. Small-molecule profiling can address disease heterogeneity by evaluating the underlying biologic state of individuals through non-invasive interrogation of plasma metabolite levels. We analyzed metabolite profiles from an oral glucose tolerance test (OGTT) in 50 individuals, 25 with normal (NGT) and 25 with impaired glucose tolerance (IGT). Our focus was to elucidate underlying biologic processes. Although we initially found little overlap between changed metabolites and preconceived definitions of metabolic pathways, the use of unbiased network approaches identified significant concerted changes. Specifically, we derived a metabolic network with edges drawn between reactant and product nodes in individual reactions and between all substrates of individual enzymes and transporters. We searched for "active modules"--regions of the metabolic network enriched for changes in metabolite levels. Active modules identified relationships among changed metabolites and highlighted the importance of specific solute carriers in metabolite profiles. Furthermore, hierarchical clustering and principal component analysis demonstrated that changed metabolites in OGTT naturally grouped according to the activities of the System A and L amino acid transporters, the osmolyte carrier SLC6A12, and the mitochondrial aspartate-glutamate transporter SLC25A13. Comparison between NGT and IGT groups supported blunted glucose- and/or insulin-stimulated activities in the IGT group. Using unbiased pathway models, we offer evidence supporting the important role of solute carriers in the physiologic response to glucose challenge and conclude that carrier activities are reflected in individual metabolite profiles of perturbation experiments. Given the involvement of transporters in human disease, metabolite profiling may contribute to improved disease classification via the interrogation of specific transporter activities.
Conflict of interest statement
The authors have declared that no competing interests exist.
Figures
Similar articles
-
Integrated pathway modules using time-course metabolic profiles and EST data from Milnesium tardigradum.BMC Syst Biol. 2012 Jun 19;6:72. doi: 10.1186/1752-0509-6-72. BMC Syst Biol. 2012. PMID: 22713133 Free PMC article.
-
Can we predict the intracellular metabolic state of a cell based on extracellular metabolite data?Mol Biosyst. 2015 Dec;11(12):3297-304. doi: 10.1039/c5mb00292c. Mol Biosyst. 2015. PMID: 26400772
-
Connecting extracellular metabolomic measurements to intracellular flux states in yeast.BMC Syst Biol. 2009 Mar 25;3:37. doi: 10.1186/1752-0509-3-37. BMC Syst Biol. 2009. PMID: 19321003 Free PMC article.
-
Current state and challenges for dynamic metabolic modeling.Curr Opin Microbiol. 2016 Oct;33:97-104. doi: 10.1016/j.mib.2016.07.008. Epub 2016 Jul 26. Curr Opin Microbiol. 2016. PMID: 27472025 Review.
-
Metabolomics and systems pharmacology: why and how to model the human metabolic network for drug discovery.Drug Discov Today. 2014 Feb;19(2):171-82. doi: 10.1016/j.drudis.2013.07.014. Epub 2013 Jul 26. Drug Discov Today. 2014. PMID: 23892182 Free PMC article. Review.
Cited by
-
Closing the 'phenotype gap' in precision medicine: improving what we measure to understand complex disease mechanisms.Mamm Genome. 2019 Aug;30(7-8):201-211. doi: 10.1007/s00335-019-09810-7. Epub 2019 Aug 19. Mamm Genome. 2019. PMID: 31428846 Review.
-
The zebrafish: scalable in vivo modeling for systems biology.Wiley Interdiscip Rev Syst Biol Med. 2011 May-Jun;3(3):335-46. doi: 10.1002/wsbm.117. Epub 2010 Sep 29. Wiley Interdiscip Rev Syst Biol Med. 2011. PMID: 20882534 Free PMC article. Review.
-
Metabolomic profiling for identification of novel potential biomarkers in cardiovascular diseases.J Biomed Biotechnol. 2011;2011:790132. doi: 10.1155/2011/790132. Epub 2011 Jan 2. J Biomed Biotechnol. 2011. PMID: 21274272 Free PMC article. Review.
-
Novel insights into obesity and diabetes through genome-scale metabolic modeling.Front Physiol. 2013 Apr 25;4:92. doi: 10.3389/fphys.2013.00092. eCollection 2013. Front Physiol. 2013. PMID: 23630502 Free PMC article.
-
RNA-Sequencing of Primary Retinoblastoma Tumors Provides New Insights and Challenges Into Tumor Development.Front Genet. 2018 May 17;9:170. doi: 10.3389/fgene.2018.00170. eCollection 2018. Front Genet. 2018. PMID: 29868118 Free PMC article.
References
-
- Zheng SL, Sun J, Wiklund F, Smith S, Stattin P, et al. Cumulative association of five genetic variants with prostate cancer. N Engl J Med. 2008;358:910–919. - PubMed
-
- Bild AH, Yao G, Chang JT, Wang Q, Potti A, et al. Oncogenic pathway signatures in human cancers as a guide to targeted therapies. Nature. 2006;439:353–357. - PubMed
-
- Golub TR, Slonim DK, Tamayo P, Huard C, Gaasenbeek M, et al. Molecular classification of cancer: class discovery and class prediction by gene expression monitoring. Science. 1999;286:531–537. - PubMed
Publication types
MeSH terms
Substances
Grants and funding
- R01 HL096738/HL/NHLBI NIH HHS/United States
- R01 DK081572/DK/NIDDK NIH HHS/United States
- T32 HL007208/HL/NHLBI NIH HHS/United States
- HG003224/HG/NHGRI NIH HHS/United States
- U01 HL081341/HL/NHLBI NIH HHS/United States
- DK081572-02/DK/NIDDK NIH HHS/United States
- HG0017115/HG/NHGRI NIH HHS/United States
- HG004233/HG/NHGRI NIH HHS/United States
- P01 NS035611/NS/NINDS NIH HHS/United States
- R01 HG003224/HG/NHGRI NIH HHS/United States
- HL096738/HL/NHLBI NIH HHS/United States
- NS035611/NS/NINDS NIH HHS/United States
- HL081341/HL/NHLBI NIH HHS/United States
- P50 HG004233/HG/NHGRI NIH HHS/United States
LinkOut - more resources
Full Text Sources
