. 2010 Feb 26;6(2):e1000782.
doi: 10.1371/journal.ppat.1000782.

Mycobacterium tuberculosis peptides presented by HLA-E molecules are targets for human CD8 T-cells with cytotoxic as well as regulatory activity

Affiliations

Mycobacterium tuberculosis peptides presented by HLA-E molecules are targets for human CD8 T-cells with cytotoxic as well as regulatory activity

Simone A Joosten et al. PLoS Pathog. .

Abstract

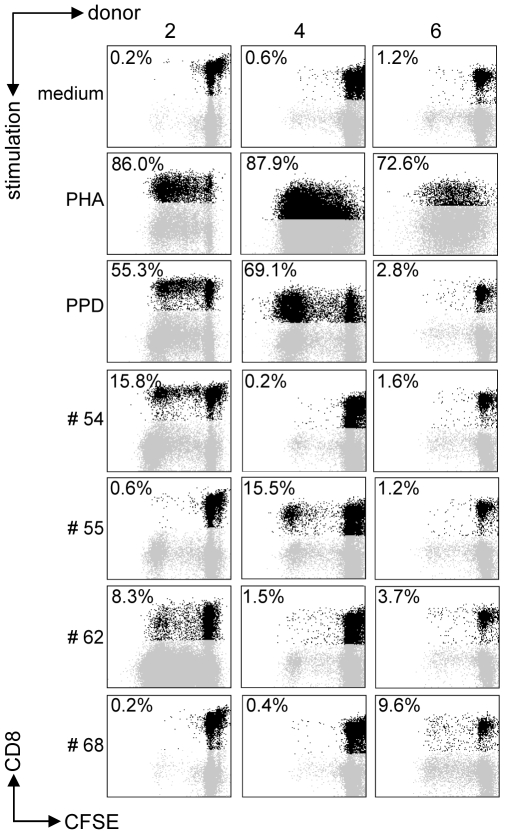
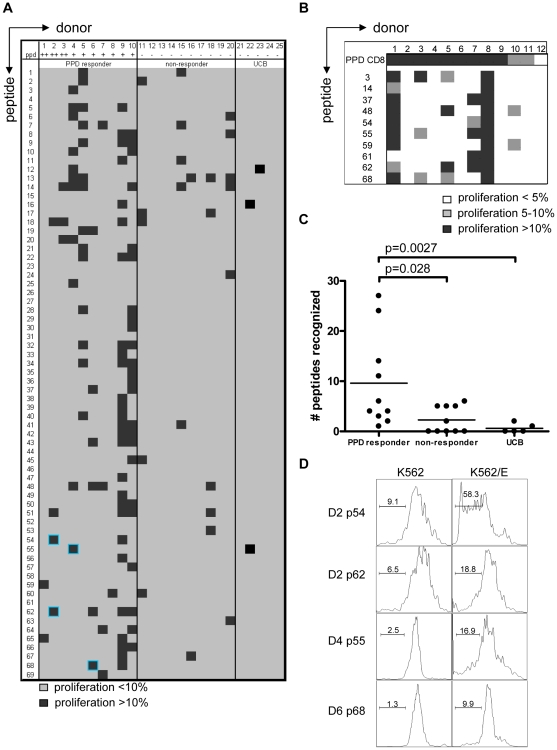
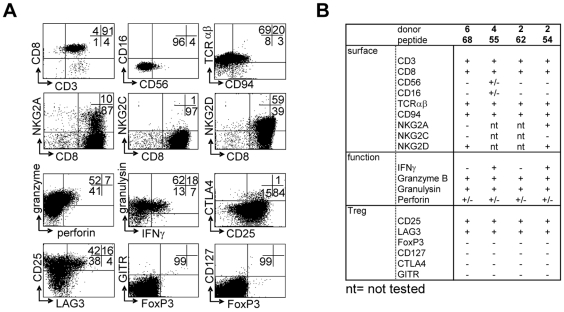
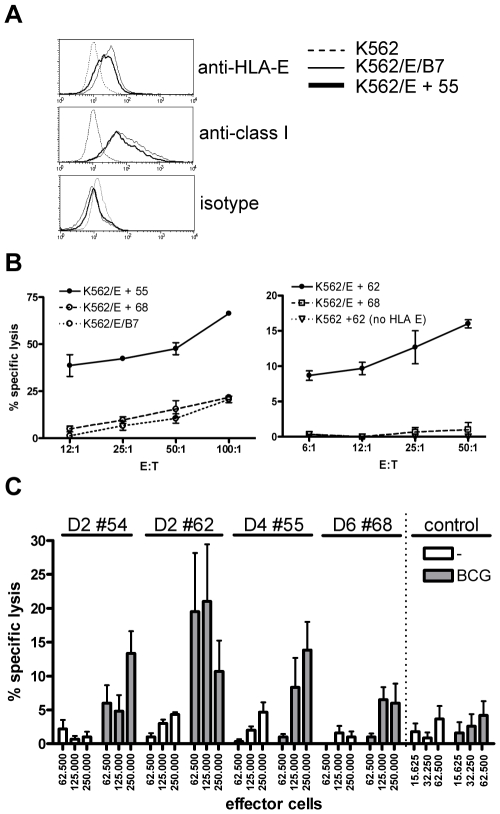
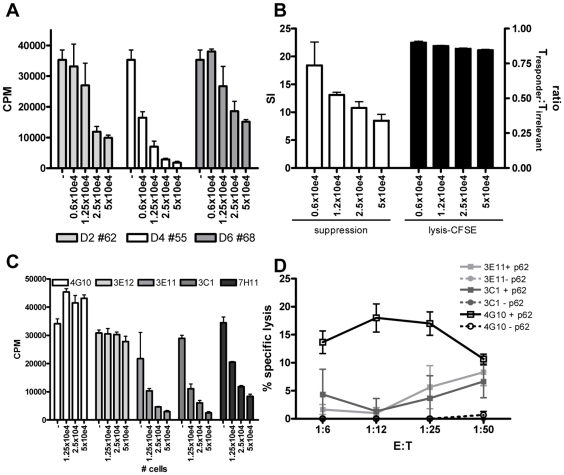
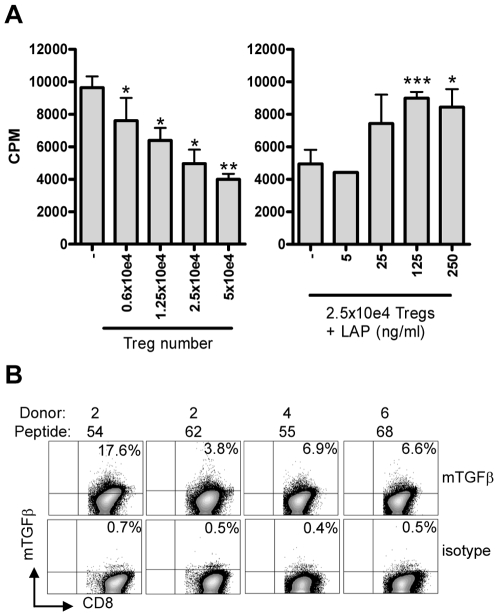
Tuberculosis (TB) is an escalating global health problem and improved vaccines against TB are urgently needed. HLA-E restricted responses may be of interest for vaccine development since HLA-E displays very limited polymorphism (only 2 coding variants exist), and is not down-regulated by HIV-infection. The peptides from Mycobacterium tuberculosis (Mtb) potentially presented by HLA-E molecules, however, are unknown. Here we describe human T-cell responses to Mtb-derived peptides containing predicted HLA-E binding motifs and binding-affinity for HLA-E. We observed CD8(+) T-cell proliferation to the majority of the 69 peptides tested in Mtb responsive adults as well as in BCG-vaccinated infants. CD8(+) T-cells were cytotoxic against target-cells transfected with HLA-E only in the presence of specific peptide. These T cells were also able to lyse M. bovis BCG infected, but not control monocytes, suggesting recognition of antigens during mycobacterial infection. In addition, peptide induced CD8(+) T-cells also displayed regulatory activity, since they inhibited T-cell proliferation. This regulatory activity was cell contact-dependent, and at least partly dependent on membrane-bound TGF-beta. Our results significantly increase our understanding of the human immune response to Mtb by identification of CD8(+) T-cell responses to novel HLA-E binding peptides of Mtb, which have cytotoxic as well as immunoregulatory activity.


Conflict of interest statement

The authors have declared that no competing interests exist.

Figures

Figure 1
Figure 1. Predicted HLA-E binding Mtb peptides induce T-cell proliferation.
CFSE-labeled PBMCs of 20 donors were stimulated with 10 µg/ml of peptide in the presence of IL-7, on day 7 low dose IL-2 was added and at day 10 proliferation was assessed by flowcytometry. Plots are gated on CD3+CD8+CD56 cells in the lymphocyte gate, the percentage of proliferation indicated is within CD3+CD8+CD56 cells. Peptide and donor numbers correspond to the numbers in Table 1.
Figure 2
Figure 2. PPD responders and BCG vaccinated infants recognize predicted HLA-E binding peptides derived from Mtb.
(A) Summary of all proliferation data from 10 PPD responders and 10 PPD non-responding donors. Proliferation was calculated using the following formula: Geometric mean of undivided population minus geometric mean of all cells. Subsequently the percentage was calculated by: (delta geo mean of sample- delta geo mean of negative control)/ delta geo mean of maximal proliferation (PHA). Samples with 10% specific proliferation or more were considered positive (black boxes). Blue highlights identify the peptides that were selected for detailed analysis. Umbilical cord blood (UCB) (n = 5) cell proliferation was assessed by the percentage of proliferating CD3+CD8+CD56 cells and proliferation >10% was considered positive. (B) PBMCs from BCG vaccinated infants (n = 12) were tested in the same way as the cells from PPD responders for 10 selected peptides. Proliferation of 5–10% is indicated in grey and proliferation >10% in black. (C) Comparison of PPD responders, non-responders & cord blood samples for peptide recognition, i.e. the number of peptides recognized per donor (n = 10 for adults, n = 5 for cord blood). Analyzed using Students T-test with a p<0.05 considered significant. (D) CD8+ T cells were purified from PBMCs by magnetic bead separation of donors 2,4 and 6 and proliferation (CFSE) in response to peptide pre-pulsed K562 cells with (right plots) or without (left plots) HLA-E was assessed. Plots are gated on CD8+CD56 cells and CFSE dilution is plotted.
Figure 3
Figure 3. Surface-, functional- and Treg marker- phenotypes of predicted HLA-E binding peptide specific T-cell lines.
(A) CD8+ T-cell lines were generated by peptide stimulation, and activated with αCD3/28 for 24 hours before staining. Brefeldin A was added for the last 16 hours only (3 µg/ml). Cells are gated on a lymphocyte gate combined with CD3 and CD8 gates. (B) Summary of phenotyping data from 3 donors and 4 peptides selected for further detailed analysis.
Figure 4
Figure 4. Predicted HLA-E binding Mtb peptide specific T-cell lines are cytotoxic.
(A) HLA-E expression on K562 cell lines after peptide loading. Upper graph, untransfected K562 cells do not stain with anti-HLA-E (3D12) antibodies, whereas HLA-E transfected K562 cells expressing the natural HLA-E ligand (HLA-B7) or cells loaded with a Mtb derived HLA-E binding peptide (#55, see Table 1) express similar levels of HLA-E. Middle graph, similar staining is observed when an antibody against HLA class I (W6/32) is used, with equal expression levels of HLA-E in the presence of a natural ligand or an Mtb derived peptide. Bottom graph, the isotype control staining for 3D12 and W6/32 was negative on all cell lines tested. HLA-E expression was always confirmed before functional experiments. (B) Peptide specific T-cell lines were generated by stimulation with peptide in the presence of IL-7 and further expansion using IL-2. K562 cells expressing HLA-E were loaded with specific and control peptides, labeled with 1 µCi 51Cr and co-cultured with T-cell lines for 5 hours in different ratios before 51Cr release was measured. Data are expressed as % specific lysis. Left graph: T-cell line derived from donor 4 directed against peptide 55 (using the high affinity HLA-E binding peptide 68 or the natural B7 ligand as irrelevant control), right graph: T-cell line derived from donor 2 directed against peptide 62 (using peptide 68 on transfected K562, or peptide 62 on untransfected K562 as irrelevant controls). Representative of 4 lines derived from 3 donors. (C) Fully HLA-A,B,C mismatched adherent monocytes were infected with live BCG (MOI 5, overnight) before labeling with 1 µCi 51Cr. Cells were co-cultured with T-cell lines for 5 hours in 6-replicate cultures. Grey bars represent BCG infected monocytes whereas white bars represent uninfected monocytes. All HLA-E peptide restricted T-cell lines recognized BCG infected target cells. In contrast a CD8+ T-cell clone restricted to the male HY antigen presented in HLA-A2 did not lyse infected monocytes, whereas the natural ligand (B-cells expressing HY in the context of HLA-A2) was specifically lysed, resulting in up to 100% target cell lysis. Data are depicted as mean+standard error of the mean and represent multiple experiments.
Figure 5
Figure 5. HLA-E binding peptide specific T-cell lines have immuno-regulatory activity.
(A) Peptide specific T-cell lines were generated by stimulation with peptide in the presence of rIL-7 and further expanded with rIL-2. To investigate their potential capacity to inhibit CD4+ T-cell activity, they were co-cultured with a well characterized CD4 Th1 clone (Rp15 1-1 (1×10e4 cells per well)) proliferating to its cognate peptide (0.5 µg/ml) presented by HLA-DR3+ cells. Dose-dependent addition of peptide stimulated cells (ranging from 0.6–5×10e4 added T-cells) reduced proliferation of the Th1 clone as measured by [3H] TdR incorporation at day 3. T-cell lines generated from 3 donors directed against 3 different peptides are shown (donor 2 against peptide 62, donor 4 against peptide 55 and donor 6 against peptide 68), the T cell line from donor 2 against peptide 54 had a similar suppressive capacity (not shown) CPM = counts per minute. (B) To exclude that suppression was merely the consequence of lysis of the responder T-cells, we analysed cell survival in a CFSE labeling experiment. The responder T-cell clone Rp15 1-1 was labeled with a low dose of CFSE (0.005 µM), whereas a second, isogenic T-cell clone with a different peptide specificity and HLA-DR2 restriction (R2F10), was labeled with a high concentration of CFSE (5 µM). Both responder and irrelevant T-cell clones were HLA-E negative. They were then co-cultured with the HLA-E binding Mtb peptide specific T-cell lines (“Treg”) in the presence of the peptide (0.5 µg/ml) recognized by the responder clone Rp15 1-1 and HLA-DR3+ APCs. After 16 hours CFSE intensity was measured by flowcytometry. In the absence of added Tregs, similar numbers of responder and irrelevant T-cell clones were retrieved (ratio of 1). The addition of “Tregs” to peptide activated or control cultures also resulted in similar numbers of both responder and irrelevant T-cells, thus indicating that the responder clone is not lysed by the Tregs. Simultaneously a 3 day co-culture was performed and analyzed by [3H] TdR uptake. This experimental set-up revealed inhibition of proliferation of the responder clone. Addition of different numbers of Tregs did inhibit proliferation in a suppression assay but not the ratio of responder over irrelevant T-cell numbers in a CFSE intensity assay. (C) Clonal populations were obtained by limiting dilution of the T-cell line of donor 2 against peptide 62, all derived from 0.1 cells/well cultures. Clones were co-cultured in different ratios to Rp15 1-1 as described in (a) and 3H TdR incorporation measured. Three out of the 5 tested clones inhibited proliferation of the indicator clone in a dose dependent manner. (D) K562 target cells selectively expressing HLA-E were loaded with peptide 62 (10 µg/ml) before 51Cr labeling, followed by 5 hour co-incubation with T-cell clones and determination of 51Cr release. Clone 4G10 strongly lysed peptide loaded target cells, whereas 3E11 and 3C1 had moderate lysing capacity.
Figure 6
Figure 6. Suppression is mediated by membrane-bound TGFβ.
(A) Co-culture assay of Treg line (donor 4, peptide 55) with responder T-cell clone (Rp15 1-1) in the presence of 0.5 µg/ml cognate peptide and HLA-DR3+ APCs results in inhibition of proliferation ([3H] TdR uptake; left graph). Right graph: Addition of LAP in this setting in the presence of a fixed number (2.5×10e4) of Tregs resulted in a dose-dependent abrogation of suppression. Experiment representative of 4 lines in 3 different experiments. *: p<0.05, **:p<0.01, ***: p<0.001 (Students T-test). (B) Surface staining of membrane bound TGFβ. T-cell lines were stained for the presence of membrane bound TGFβ using the TB21 monoclonal antibody, gated on CD25+ cells. mTGFβ staining was observed on all 4 lines, although to a variable extent, the isotype control was used to place markers and was negative for all lines (bottom).

Similar articles

Cited by

References

    1. World Health Organization. Global Tuberculosis Control. 2004. WHO report, WHO, Geneva.
    1. Fine PE, Rodrigues LC. Modern vaccines. Mycobacterial diseases. Lancet. 1990;335:1016–1020. - PubMed
    1. Ottenhoff TH. Overcoming the global crisis: “yes, we can”, but also for TB …? Eur J Immunol. 2009;39:2014–2020. - PubMed
    1. Kaufmann SH. Envisioning future strategies for vaccination against tuberculosis. Nat Rev Immunol. 2006;6:699–704. - PubMed
    1. Kaufmann SH. How can immunology contribute to the control of tuberculosis? Nat Rev Immunol. 2001;1:20–30. - PubMed

Publication types

MeSH terms