

The genetic interpretation of area under the ROC curve in genomic profiling
- PMID: 20195508
- PMCID: PMC2829056
- DOI: 10.1371/journal.pgen.1000864
The genetic interpretation of area under the ROC curve in genomic profiling
Abstract
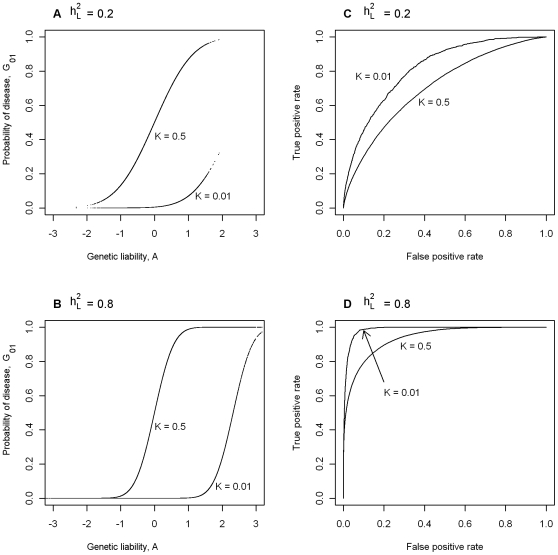
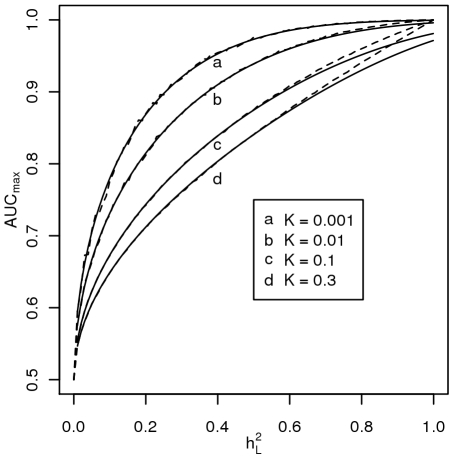
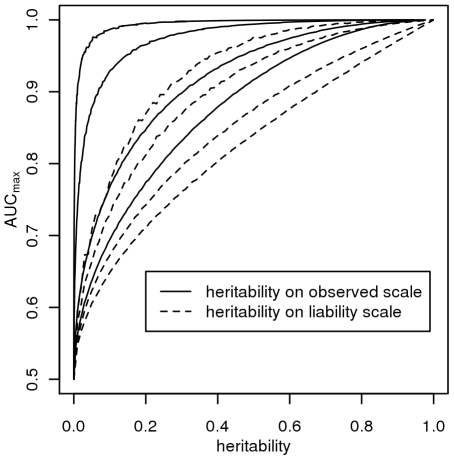
Genome-wide association studies in human populations have facilitated the creation of genomic profiles which combine the effects of many associated genetic variants to predict risk of disease. The area under the receiver operator characteristic (ROC) curve is a well established measure for determining the efficacy of tests in correctly classifying diseased and non-diseased individuals. We use quantitative genetics theory to provide insight into the genetic interpretation of the area under the ROC curve (AUC) when the test classifier is a predictor of genetic risk. Even when the proportion of genetic variance explained by the test is 100%, there is a maximum value for AUC that depends on the genetic epidemiology of the disease, i.e. either the sibling recurrence risk or heritability and disease prevalence. We derive an equation relating maximum AUC to heritability and disease prevalence. The expression can be reversed to calculate the proportion of genetic variance explained given AUC, disease prevalence, and heritability. We use published estimates of disease prevalence and sibling recurrence risk for 17 complex genetic diseases to calculate the proportion of genetic variance that a test must explain to achieve AUC = 0.75; this varied from 0.10 to 0.74. We provide a genetic interpretation of AUC for use with predictors of genetic risk based on genomic profiles. We provide a strategy to estimate proportion of genetic variance explained on the liability scale from estimates of AUC, disease prevalence, and heritability (or sibling recurrence risk) available as an online calculator.
Conflict of interest statement
The authors have declared that no competing interests exist.
Figures
References
-
- McCarthy MI, Abecasis GR, Cardon LR, Goldstein DB, Little J, et al. Genome-wide association studies for complex traits: consensus, uncertainty and challenges. Nature Reviews Genetics. 2008;9:356–369. - PubMed
-
- Iles MM. What can genome-wide association studies tell us about the genetics of common disease? PLoS Genet. 2008;4:e33. doi: 10.1371/journal.pgen.0040033. - DOI - PMC - PubMed
-
- Janssens AC, Aulchenko YS, Elefante S, Borsboom GJ, Steyerberg EW, et al. Predictive testing for complex diseases using multiple genes: fact or fiction? Genet Med. 2006;8:395–400. - PubMed
-
- Kraft P, Wacholder S, Cornelis MC, Hu FB, Hayes RB, et al. OPINION Beyond odds - ratios communicating disease risk based on genetic profiles. Nature Reviews Genetics. 2009;10:264–269. - PubMed
Publication types
MeSH terms
LinkOut - more resources
Full Text Sources
Other Literature Sources
