

Increased alpha-defensins 1-3 production by dendritic cells in HIV-infected individuals is associated with slower disease progression
- PMID: 20195543
- PMCID: PMC2828484
- DOI: 10.1371/journal.pone.0009436
Increased alpha-defensins 1-3 production by dendritic cells in HIV-infected individuals is associated with slower disease progression
Abstract
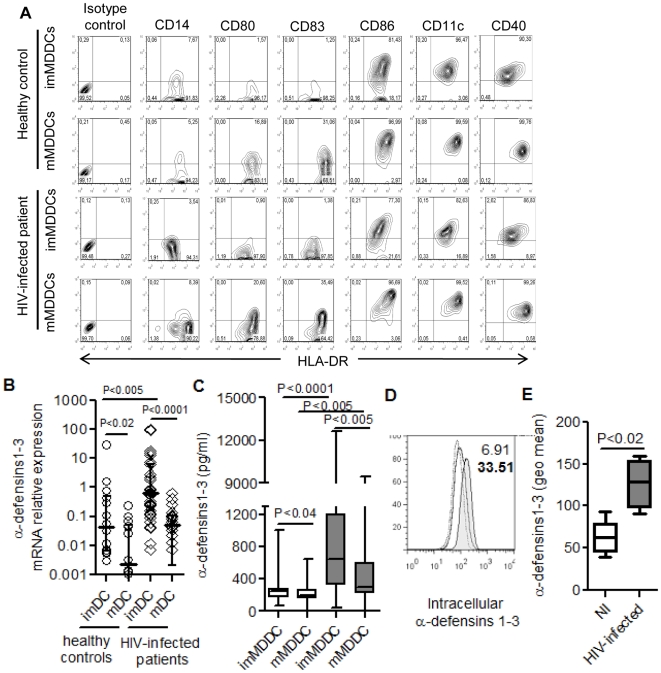
Background: Defensins are natural endogenous antimicrobial peptides with potent anti-HIV activity and immuno-modulatory effects. We recently demonstrated that immature dendritic cells (DC) produce alpha-defensins1-3 and that alpha-defensins1-3 modulate DC generation and maturation. Since DC-HIV interaction plays a critical role during the first steps of HIV infection, we investigated the possible impact of alpha-defensins1-3 production by DC on disease progression.
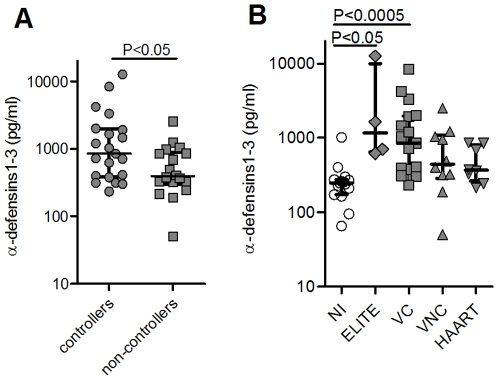
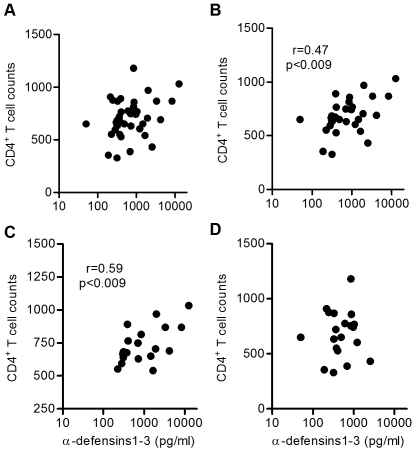
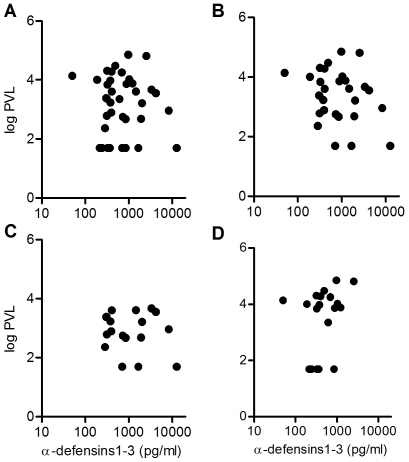
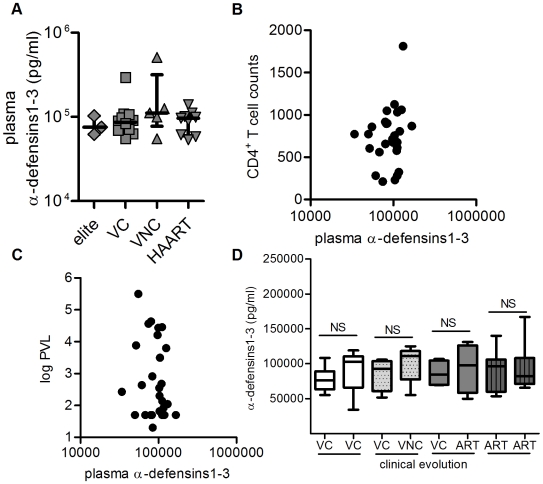
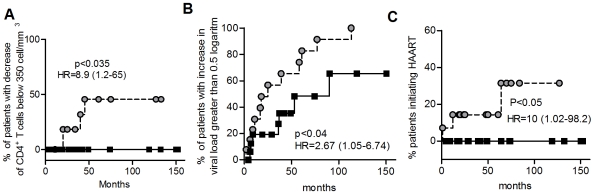
Methodology/principal findings: Monocyte-derived DC (MDDC) were analyzed comparatively in healthy controls (HC) and HIV-infected patients, including untreated "elite" and "viremic" controllers, untreated viremic non-controllers and antiretroviral-treated patients. We found that production of alpha-defensins1-3 was significantly increased in MDDC from HIV-infected patients versus HC, and this increase was mainly due to that observed in controllers, while in non-controllers the increase was not statistically significant (controllers vs. HC, p<0.005; controllers vs. non-controllers p<0.05). Secreted alpha-defensins1-3 by immature MDDC positively correlated with CD4 T cell counts in controllers, but not in non-controllers. Moreover, independently of their clinical classification, HIV-infected patients with higher alpha-defensins1-3 secretion by immature MDDC showed slower disease progression, measured as no decrease in the number of CD4+ T-cells below 350 cell/mm(3), lower increase of plasma viral load and no initiation of treatment over time. Plasma alpha-defensins1-3 levels lacked any relationship with immunologic and virologic parameters.
Conclusions/significance: High production of alpha-defensins1-3 by immature DCs appears as a host protective factor against progression of HIV-1 infection, suggesting potential diagnostic, therapeutic and preventive implications. This protective effect may arise from the activity of alpha-defensins1-3 to damage the virions prior and/or after their internalization by immature DC, and hence favoring a more efficient viral processing and presentation to HIV-specific CD4+ T cells, without or with a minor rate of transmission of infectious HIV-1 virions.
Conflict of interest statement
Figures
Similar articles
-
Impact of alpha-defensins1-3 on the maturation and differentiation of human monocyte-derived DCs. Concentration-dependent opposite dual effects.Clin Immunol. 2009 Jun;131(3):374-84. doi: 10.1016/j.clim.2009.01.012. Epub 2009 Feb 23. Clin Immunol. 2009. PMID: 19237318
-
Higher SLPI expression, lower immune activation, and increased frequency of immune cells in a cohort of Colombian HIV-1 controllers.J Acquir Immune Defic Syndr. 2012 May 1;60(1):12-9. doi: 10.1097/QAI.0b013e31824876ca. J Acquir Immune Defic Syndr. 2012. PMID: 22240462
-
Human immature monocyte-derived dendritic cells produce and secrete alpha-defensins 1-3.J Leukoc Biol. 2007 Nov;82(5):1143-6. doi: 10.1189/jlb.0507295. Epub 2007 Aug 7. J Leukoc Biol. 2007. PMID: 17684038
-
The interaction of immunodeficiency viruses with dendritic cells.Curr Top Microbiol Immunol. 2003;276:1-30. doi: 10.1007/978-3-662-06508-2_1. Curr Top Microbiol Immunol. 2003. PMID: 12797441 Review.
-
Characteristics of plasmacytoid dendritic cell and CD4+ T cell in HIV elite controllers.Clin Dev Immunol. 2012;2012:869505. doi: 10.1155/2012/869505. Epub 2012 Nov 21. Clin Dev Immunol. 2012. PMID: 23243424 Free PMC article. Review.
Cited by
-
Estradiol reduces susceptibility of CD4+ T cells and macrophages to HIV-infection.PLoS One. 2013 Apr 17;8(4):e62069. doi: 10.1371/journal.pone.0062069. Print 2013. PLoS One. 2013. PMID: 23614015 Free PMC article.
-
Cell-Mediated Immunity in Elite Controllers Naturally Controlling HIV Viral Load.Front Immunol. 2013 Apr 9;4:86. doi: 10.3389/fimmu.2013.00086. eCollection 2013. Front Immunol. 2013. PMID: 23577012 Free PMC article.
-
Antiviral mechanisms of human defensins.J Mol Biol. 2013 Dec 13;425(24):4965-80. doi: 10.1016/j.jmb.2013.09.038. Epub 2013 Oct 2. J Mol Biol. 2013. PMID: 24095897 Free PMC article. Review.
-
Macaque paneth cells express lymphoid chemokine CXCL13 and other antimicrobial peptides not previously described as expressed in intestinal crypts.Clin Vaccine Immunol. 2013 Aug;20(8):1320-8. doi: 10.1128/CVI.00651-12. Epub 2013 Jun 26. Clin Vaccine Immunol. 2013. PMID: 23803902 Free PMC article.
-
Gut Leakage Markers and Cognitive Functions in Patients with Attention-Deficit/Hyperactivity Disorder.Children (Basel). 2023 Mar 5;10(3):513. doi: 10.3390/children10030513. Children (Basel). 2023. PMID: 36980071 Free PMC article.
References
-
- Chang TL, Klotman ME. Defensins: natural anti-HIV peptides. AIDS Rev. 2004;6:161–168. - PubMed
-
- Yang D, Biragyn A, Hoover DM, Lubkowski J, Oppenheim JJ. Multiple roles of antimicrobial defensins, cathelicidins, and eosinophil-derived neurotoxin in host defense. Annu Rev Immunol. 2004;22:181–215. - PubMed
-
- Klotman ME, Chang TL. Defensins in innate antiviral immunity. Nat Rev Immunol. 2006;6:447–456. - PubMed
-
- Mackewicz CE, Yuan J, Tran P, Diaz L, Mack E, et al. alpha-Defensins can have anti-HIV activity but are not CD8 cell anti-HIV factors. AIDS. 2003;17:F23–F32. - PubMed
Publication types
MeSH terms
Substances
LinkOut - more resources
Full Text Sources
Other Literature Sources
Medical
Research Materials
