. 2010 Feb 25;5(2):e9427.
doi: 10.1371/journal.pone.0009427.

MYC overexpression induces prostatic intraepithelial neoplasia and loss of Nkx3.1 in mouse luminal epithelial cells

Affiliations

MYC overexpression induces prostatic intraepithelial neoplasia and loss of Nkx3.1 in mouse luminal epithelial cells

Tsuyoshi Iwata et al. PLoS One. .

Abstract

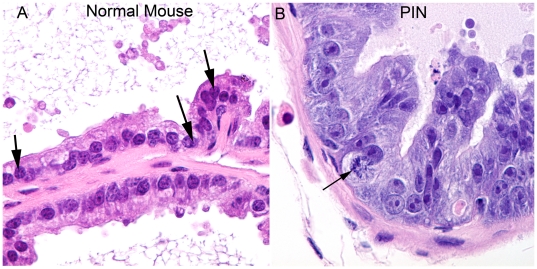
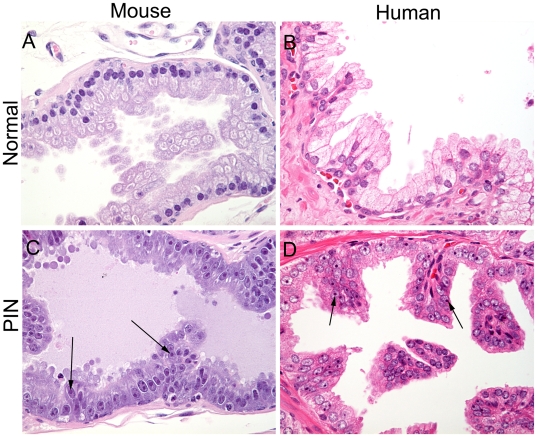
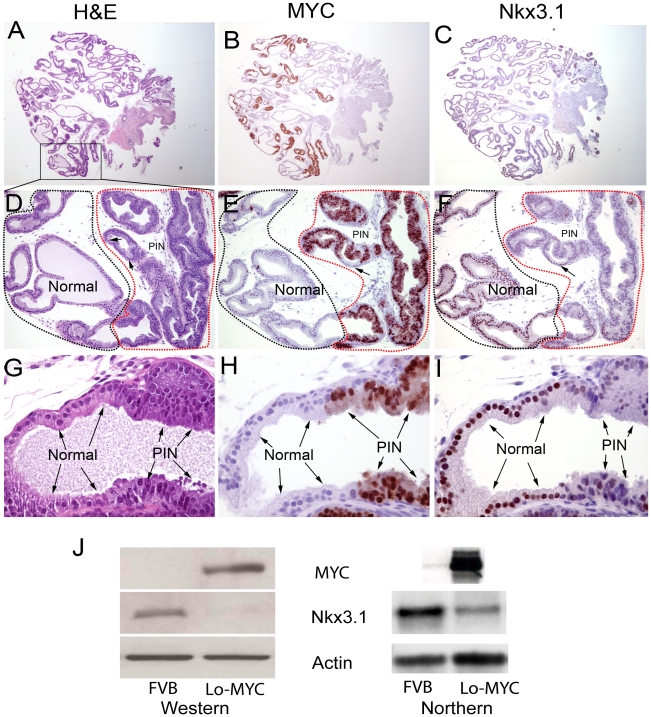
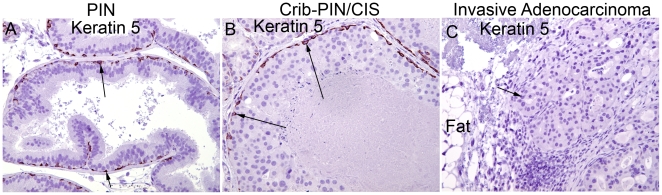
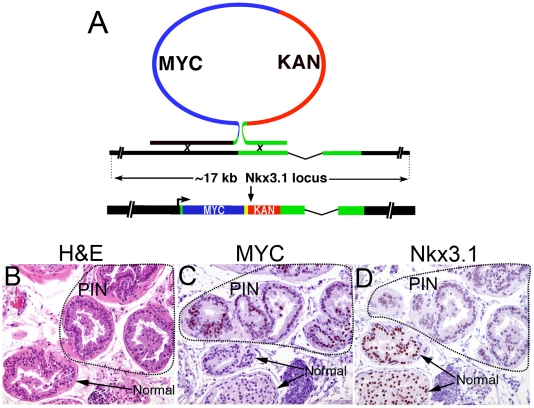
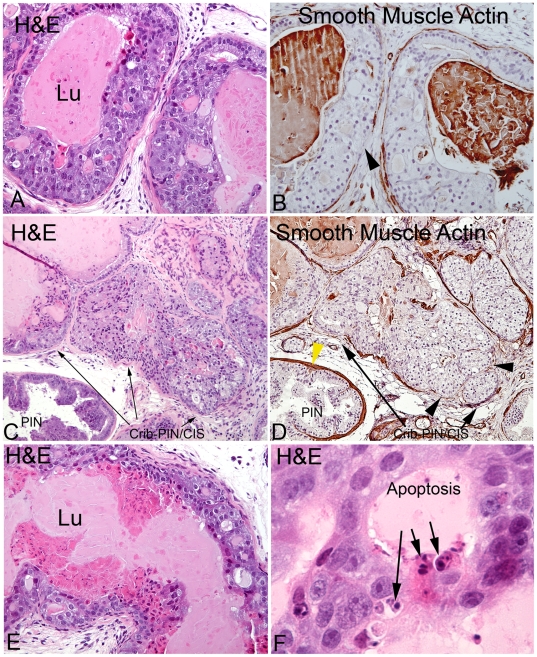
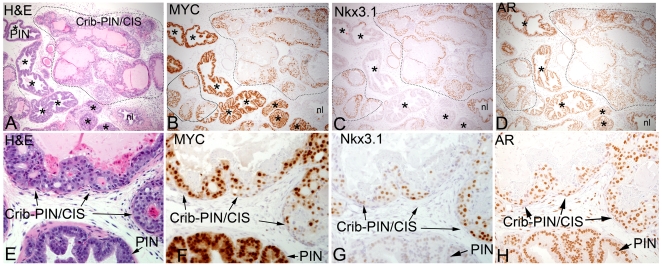
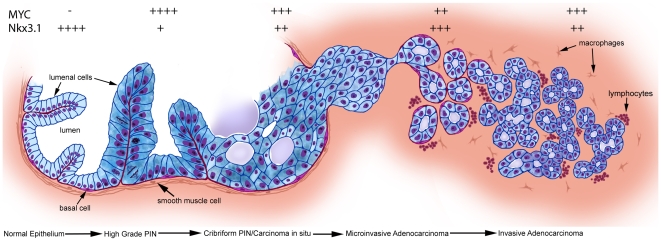
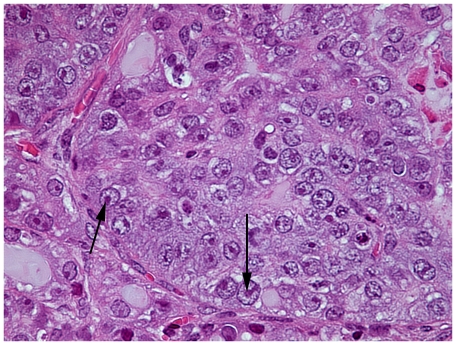
Lo-MYC and Hi-MYC mice develop prostatic intraepithelial neoplasia (PIN) and prostatic adenocarcinoma as a result of MYC overexpression in the mouse prostate. However, prior studies have not determined precisely when, and in which cell types, MYC is induced. Using immunohistochemistry (IHC) to localize MYC expression in Lo-MYC transgenic mice, we show that morphological and molecular alterations characteristic of high grade PIN arise in luminal epithelial cells as soon as MYC overexpression is detected. These changes include increased nuclear and nucleolar size and large scale chromatin remodeling. Mouse PIN cells retained a columnar architecture and abundant cytoplasm and appeared as either a single layer of neoplastic cells or as pseudo-stratified/multilayered structures with open glandular lumina-features highly analogous to human high grade PIN. Also using IHC, we show that the onset of MYC overexpression and PIN development coincided precisely with decreased expression of the homeodomain transcription factor and tumor suppressor, Nkx3.1. Virtually all normal appearing prostate luminal cells expressed high levels of Nkx3.1, but all cells expressing MYC in PIN lesions showed marked reductions in Nkx3.1, implicating MYC as a key factor that represses Nkx3.1 in PIN lesions. To determine the effects of less pronounced overexpression of MYC we generated a new line of mice expressing MYC in the prostate under the transcriptional control of the mouse Nkx3.1 control region. These "Super-Lo-MYC" mice also developed PIN, albeit a less aggressive form. We also identified a histologically defined intermediate step in the progression of mouse PIN into invasive adenocarcinoma. These lesions are characterized by a loss of cell polarity, multi-layering, and cribriform formation, and by a "paradoxical" increase in Nkx3.1 protein. Similar histopathological changes occurred in Hi-MYC mice, albeit with accelerated kinetics. Our results using IHC provide novel insights that support the contention that MYC overexpression is sufficient to transform prostate luminal epithelial cells into PIN cells in vivo. We also identified a novel histopathologically identifiable intermediate step prior to invasion that should facilitate studies of molecular pathway alterations occurring during early progression of prostatic adenocarcinomas.


Conflict of interest statement

Competing Interests: The authors have declared that no competing interests exist.

Figures

Figure 1
Figure 1. Morphological appearance of PIN lesions in the Lo-MYC mice in H&E stained tissue sections.
This high power view shows the marked nucleolar enlargement as well as global changes in chromatin architecture including large-scale chromatin clearing that occurs in the mouse PIN cells as compared to the normal mouse prostate epithelial cells in an 8 week-old Lo-MYC mouse ventral prostate (original magnification 600×). Note that the mouse normal epithelial cells (A) show a relatively homogeneous chromatin distribution that is interrupted by a number of darkly staining punctate regions that are quite characteristic of mouse chromatin (arrows). This homogeneous chromatin distribution and the darkly staining regions are virtually abolished in the PIN cells (B) as a direct consequence of the MYC overexpression. The normal appearing epithelium contains only small nucleoli and much smaller nuclei than the PIN cells. Arrow in B indicates mitotic figure in PIN lesion.
Figure 2
Figure 2. Morphological comparison of mouse and human normal appearing epithelium and PIN lesions.
All images were taken at the same magnification and processed similarly to allow direct comparisons (400 ×). (A) Normal appearing mouse epithelium. (B) Normal appearing human prostate epithelium. (C) PIN lesion in a Lo-MYC mouse prostate. (D) PIN lesion in a human prostate. Arrows indicate enlarged nucleoli.
Figure 3
Figure 3. MYC overexpression corresponds precisely to morphological changes in luminal cells that are characteristic of PIN.
(A–C). Low power (original magnification 20×) image of an entire lobe of a mouse ventral prostate at four weeks of age from a Lo-MYC mouse. Stains are indicated above images. Sections are not directly adjacent but are within ∼25–40 µM (of each other. Note the highly heterogeneous nature of the staining for MYC and Nkx3.1. (D–F). Medium power (100 ×) view of regions shown in the box in Figure 3A. Regions corresponding to normal appearing epithelium are circled in black, and regions corresponding to PIN lesions are circled in red. Note that regions of PIN are staining positively for MYC and the same regions are staining at a much reduced level for Nkx3.1. Also note small area in panel E that lacks staining for MYC, indicated by the arrow, which has strong positive staining for Nkx3.1 (indicated by the arrow in panel F). (G–I). Higher power image of region of transition between normal epithelium and PIN (the lowermost gland in panels D–F). Here it is clearly evident that cells corresponding to PIN cells, as shown in the H&E section (panel G) are the same cells that are staining strongly positive for MYC, and the same cells that have markedly reduced staining for Nkx3.1. (J) Western blot (left) showing reduced Nkx3.1 protein in a Lo-MYC mouse ventral prostate with PIN, as compared to an FVB wild-type mouse at the same age (six months). Northern blot (right) showing reduced Nkx3.1 mRNA in a Lo-MYC mouse ventral prostate with PIN as compared to an FVB mouse at the same age (9 weeks). Top right shows MYC mRNA is highly elevated in another Lo-MYC mouse ventral prostate as compared to a matched FVB wild-type (9 weeks).
Figure 4
Figure 4. Neoplastic appearing PIN and cribriform PIN/CIS cells and adenocarcinoma cells are negative for basal cell specific Keratin 5 staining (original magnification 200×).
(A) A mouse PIN lesion from a Lo-MYC mouse showing that neoplastic appearing cells are negative for Keratin 5 and that there is a largely intact layer of benign appearing flattened basal cells. (B) A similar basal cell layer is highlighted by staining positively for Keratin 5 in a cribriform PIN/CIS lesion. (C) A frankly invasive adenocarcinoma lesion in a Lo-MYC mouse, showing invasion into the peri-prostatic fatty tissue, that is completely devoid of basal cells or any tumor cell Keratin 5 staining. Arrow indicates invasive adenocarcinoma gland.
Figure 5
Figure 5. Generation and characterization of the “Super Lo-MYC” mouse model.
(A) Schematic representation of the recombineering approach used to generate the Nkx3.1-MYC transgene. A MYC/KAN cassette flanked by Nkx3.1 homologous arms was recombined in bacteria with a vector containing ∼17 kb of the Nkx3.1 genomic locus. In the final transgene construct, the MYC-encoding mRNA initiates at the Nkx3.1 transcriptional start site and the SV40 early poly(A) signal (yellow box) mediates polyadenylation. (B–D) PIN lesion developing in a Super Lo-MYC mouse. All magnifications are 100×. (B) H&E section in which PIN lesion is circled. (C) MYC IHC staining showing that a large fraction of cells in the PIN lesion are staining weakly to moderately positive. (D) NKX3.1 is reduced in the same PIN appearing cells that are positive for MYC staining.
Figure 6
Figure 6. Characterization of cribriform PIN/CIS lesions in the Lo-MYC mouse model.
(A) H&E section of an early cribriform PIN/CIS lesion, without microinvasion, showing multilayering of cells partially filling the lumen. Note the loss of columnar cell polarity and the variable decrease in nucleolar size as compared to PIN lesions shown in Figures 1– 3 (original magnification 200×). (B) Smooth muscle actin staining showing a highly attenuated smooth muscle cell layer in the same lesion from an adjacent section (original magnification 200×). (C) H&E stained section of a more advanced cribriform PIN/CIS lesion that shows early development of microinvasion, which is better shown in panel (D) by smooth muscle actin staining (original magnification 100×). Black arrowheads showed regions of complete smooth muscle loss. Yellow arrowhead shows intact smooth muscle layer around a PIN gland (C–D, original magnification 100×). (E) H&E section of another cribriform PIN/CIS lesion showing apoptosis and necrosis towards the lumen (original magnification 200×). (F) Higher magnification view (600×) showing morphological evidence of apoptosis in a different cribriform PIN/CIS lesion.
Figure 7
Figure 7. MYC levels are reduced and Nkx3.1 protein is markedly increased in cribriform PIN/CIS lesions.
(A–D) Low power view (original magnification 40×) of the ventral prostate from a Lo-MYC MYC mouse at 1 year of age that contains residual PIN glands (*) and cribriform PIN/CIS (circled in black dotted line). (E–H) A higher power view (original magnification 200×) of a different mouse showing both PIN and cribriform PIN/CIS in the same microscopic field. Immunostains as indicated show a moderate reduction in MYC staining overall and a marked increase in Nkx3.1 in cribriform PIN/CIS areas. AR expression is retained in both PIN and cribriform PIN/CIS.
Figure 8
Figure 8. New model of progression from normal to PIN to cribriform PIN/CIS to microinvasive adenocarcinoma in Lo-MYC and Hi-MYC mice.
Relative levels of nuclear staining for Nkx3.1 and MYC are indicated. In normal epithelium, MYC levels are generally undetectable (−) although low levels can be seen. Conversely, very high levels (++++) of Nkx3.1 are present in normal epithelium. In high grade pin lesions, MYC levels are markedly elevated (++++), and Nkx3.1 levels are markedly reduced (+) as compared to normal epithelium. In cribriform PIN/in situ carcinoma lesions, MYC levels are reduced somewhat compared to high grade PIN (+++), although still markedly above levels in normal epithelium. Here, Nkx3.1 levels are elevated (++) as compared to high grade PIN, although they are still somewhat reduced compared to normal epithelium. As invasive tumors become somewhat larger, MYC levels increase again (+++), although they are not quite as elevated and are more variable than in the high grade PIN lesions. Nkx3.1 levels (++) are also more variable here.
Figure 9
Figure 9. Nuclear atypia resumes in larger adenocarcinoma lesions.
High power view (original magnification 400×) of an H&E stained section of invasive adenocarcinoma lesion in Lo-MYC mouse showing cells with large nucleoli, similar to that seen in PIN lesions. These lesions stain nearly as strongly for MYC as PIN lesions, and there is also fairly high levels of Nkx3.1 protein (e.g. much higher than PIN and similar to cribriform PIN/CIS).

Similar articles

Cited by

References

    1. Ellwood-Yen K, Graeber TG, Wongvipat J, Iruela-Arispe ML, Zhang J, et al. Myc-driven murine prostate cancer shares molecular features with human prostate tumors. Cancer Cell. 2003;4:223–238. - PubMed
    1. Abate-Shen C, Shen MM. Molecular genetics of prostate cancer. Genes Dev. 2000;14:2410–2434. - PubMed
    1. Elo JP, Visakorpi T. Molecular genetics of prostate cancer. Ann Med. 2001;33:130–141. - PubMed
    1. Nelson WG, De Marzo AM, Isaacs WB. Prostate cancer. N Engl J Med. 2003;349:366–381. - PubMed
    1. Gonzalgo ML, Isaacs WB. Molecular pathways to prostate cancer. J Urol. 2003;170:2444–2452. - PubMed

Publication types

MeSH terms