. 2010 Apr 28;428(1):75-84.
doi: 10.1042/BJ20090977.

Analysis of the interactions between the C-terminal cytoplasmic domains of KCNQ1 and KCNE1 channel subunits

Affiliations

Analysis of the interactions between the C-terminal cytoplasmic domains of KCNQ1 and KCNE1 channel subunits

Renjian Zheng et al. Biochem J. .

Abstract

Ion channel subunits encoded by KCNQ1 and KCNE1 produce the slowly activating K+ current (IKs) that plays a central role in myocardial repolarization. The KCNQ1 alpha-subunit and the KCNE1 beta-subunit assemble with their membrane-spanning segments interacting, resulting in transformation of channel activation kinetics. We recently reported a functional interaction involving C-terminal portions of the two subunits with ensuing regulation of channel deactivation. In the present study, we provide evidence characterizing a physical interaction between the KCNQ1-CT (KCNE1 C-terminus) and the KCNE1-CT (KCNE1 C-terminus). When expressed in cultured cells, the KCNE1-CT co-localized with KCNQ1, co-immunoprecipitated with KCNQ1 and perturbed deactivation kinetics of the KCNQ1 currents. Purified KCNQ1-CT and KCNE1-CT physically interacted in pull-down experiments, indicating a direct association. Deletion analysis of KCNQ1-CT indicated that the KCNE1-CT binds to a KCNQ1 region just after the last transmembrane segment, but N-terminal to the tetramerization domain. SPR (surface plasmon resonance) corroborated the pull-down results, showing that the most proximal region (KCNQ1 amino acids 349-438) contributed most to the bimolecular interaction with a dissociation constant of approximately 4 microM. LQT (long QT) mutants of the KCNE1-CT, D76N and W87F, retained binding to the KCNQ1-CT with comparable affinity, indicating that these disease-causing mutations do not alter channel behaviour by disruption of the association. Several LQT mutations involving the KCNQ1-CT, however, showed various effects on KCNQ1/KCNE1 association. Our results indicate that the KCNQ1-CT and the KCNE1-CT comprise an independent interaction domain that may play a role in IKs channel regulation that is potentially affected in some LQTS (LQT syndrome) mutations.


Figures

Figure 1
Figure 1. KCNQ and KCNE family K channel subunits
(A) Sequence alignment of KCNE1 cytoplasmic domains with C-termini of the other KCNE family members. (B) Alignments of the partial amino acid sequences of KCNQ1 C-terminal region containing helix A compared to other KCNQ family members. (C) Schematic representation of recombinant constructs use in this study. Q1Cf refers to the full-length KCNQ1-C-terminus and Q1C1, Q1C2, Q1C3, Q1C1A, Q1C1B each refer to truncated Versions as illustrated. E1C refers to the KCNE1-C-terminus. Boldface residues are those subjected to mutagenesis. All recombinant proteins were expressed in E. coli BL21 (DE3) pLsS strains, and purified with a Ni-affinity column followed by Superdex 200 gel filtration chromatography. (Numbers indicate amino acid position; black and shaded boxes represent α-helical segments)
Figure 2
Figure 2. Functional interaction of free-KCNE1-CT with KCNQ1 channels
(A) Schematic Diagram of KCNQ1 and KCNE1 channel subunits with cylinders representing predicted α-helices. (B) Voltage clamp current traces (elicited by depolarizing voltage steps) of KCNQ1 alone, KCNQ1/KCNE1-CT, KCNQ1/KCNE1 and KCNQ1/KCNE1/KCNE1-CT channels expressed in CHO cells. (C) Deactivation rates plotted against voltage from CHO cells expressing KCNQ1 either without KCNE1, or with KCNE1, KCNE1-CT, or with both KCNE1 and KCNE1-CT. (D) Normalized voltage-dependence of activation curves from same cells as in panel C.
Figure 3
Figure 3
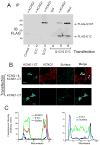
Co-immunoprecipitation of the C-terminal cytoplasmic regions of KCNQ1 and KCNE1 and co-localization of KCNE1 C-terminus and KCNQ1 in the surface of live HEK cells. (A) Immunoblot analysis from HEK 293 cells co-transfected with E1C (lane 2), Q1Cf (lane 3), or both (lanes 4–6). E1C was co-immunoprecipitated with Q1Cf by anti-KCNQ1 antibody (Santa Cruz) (lane 5). Lane 4 shows results from nonspecific antibody IP and lane 6 shows input lysate prior to IP demonstrating expression levels. (B) HEK 293 cell line stably expressing full-length KCNQ1 channels (top row of micrographs) or HEK 293 cells (bottom row of micrographs) were transfected with Flag-tagged KCNE1 C-terminus expression plasmids, and the subcellular distribution of the KCNE1 C-terminus was detected by immunofluorescence using confocal microscopy. KCNE1-CT staining is shown in green, KCNQ1 in red and cadherin (surface) in blue. (C) Graphical analysis of signal strength across co-transfected cells (indicated by solid white line in right panels of 3B) for KCNQ1 plus KCNE1-CT (on left) and KCNe1-CT without KCNQ1 (on right).
Figure 4
Figure 4
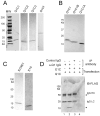
Association of purified, recombinant C-terminal cytoplasmic regions of KCNQ1-KCNE1. (A) Coomassie-stained SDS-PAGE of purified recombinant KCNQ1-C-terminal protein fragments, Q1C1, Q1C2, Q1C3, and Q1Cf (1–4). (B) Coomassie-stained SDS-PAGE of purified recombinant proteins, Q1C1, Q1C1B and Q1C1A (1–3). (C) Coomassie-stained SDS-PAGE of purified recombinant protein, KCNE1 (1st lane) and KCNE1 C-terminus (2nd lane). (D) Immunoblot of Co-IP analysis of the interaction between the full length C-termini of KCNQ1 and KCNE1. Reactions included KCNQ1-Cf (all lanes) and KCNE1-CT (lanes 2–4). Anti-KCNQ1 antibody was used for IP in lanes 1 & 2, control antibody in lane 3 and protein-G beads alone in lane 4 for controls. Immunoblots for FLAG-tagged KCNE1-CT and KCNQ1-Cf show that only IP of KCNQ1-Cf co-precipitated KCNE1-CT (arrows indicate KCNQ1-Cf and KCNE1-CT).
Figure 5
Figure 5
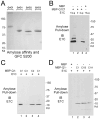
Interaction of KCNQ1 C-terminal cytoplasmic domains with KCNE1 C-terminus. (A) Coomassie-stained SDS-PAGE of purified MBP-fusion proteins, MBP- Q1Cf, MBP-Q1C1, MBP-Q1C2, and MBP-Q1C3. (B) Immunoblot analysis of association of KCNE1 C-terminus with KCNQ1-Cf. Pulldown of MBP-Q1Cf with immobilized amylose co-precipitated KCNE1-CT (lanes 1 & 3) however MBP alone did not pull down KCNE1-CT (lane 4). (C) Immunoblot analysis of MBP-pulldown reaction demonstrates KCNQ1-C-terminal fragments Q1Cf, Q1C2 and Q1C1 each co-precipitate KCNE1-CT but not KCNQ1-C3. (D) Immunoblot analysis of MBP-pulldown reaction demonstrates KCNQ1-C-terminal fragments Q1C1, Q1C1B and Q1C1A each co-precipitate KCNE1-CT.
Figure 6
Figure 6
Surface plasmon resonance analysis of the interactions of KCNQ1 C-terminal cytoplasmic domains with KCNE1 C-Terminus. SPR analysis was carried out as described in Materials and Methods. (A) Illustrates a typical sensorgram for the interaction of various concentrations of the Q1C1 fragment of KCNQ1 with E1C immobilized on a CI sensor chip. Each trace represents the response to increasing concentrations of Q1C1. Introduction of each concentration of Q1C1 is started at time=0 and washout at 750 seconds. (The concentration ranges used were 0.5–10 μM for KCNQ1 C-terminal fragments.) (B) A typical plot of sensorgram data is show for a Q1C1-E1C interaction experiment. The data were fitted separately for each experiment to the two-state binding model where A + B ↔ AB* ↔ AB, as described in the Methods section. (C) The graph shows maximum response values (RUmax) for the highest concentration (10μM) of various KCNQ1-C-terminal fragments and LQT1 mutants. These data were used to derive Kd calculations shown in Table 1.

Similar articles

Cited by

References

    1. Robbins J. KCNQ potassium channels: physiology, pathophysiology, and pharmacology. Pharmacol Ther. 2001;90:1–19. - PubMed
    1. Barhanin J, Lesage F, Guillemare E, Fink M, Lazdunski M, Romey G. KVLQT1 and IsK (minK) proteins associate to form IKs cardiac potassium current. Nature. 1996;384:78–80. - PubMed
    1. Sanguinetti MC, Curran ME, Zou A, Shen J, Spector PS, Atkinson DL, Keating MT. Coassembly of KVLQT1 and minK (IsK) proteins to form cardiac IKs potassium channel. Nature. 1996;384:80–83. - PubMed
    1. Keating MT, Sanguinetti MC. Molecular and cellular mechanisms of cardiac arrhythmias. Cell. 2001;104:569–580. - PubMed
    1. Splawski I, Tristani-Firouzi M, Lehmann MH, Sanguinetti MC, Keating MT. Mutations in the hminK gene cause long QT syndrome and suppress IKs function. Nat Genet. 1997;17:338–340. - PubMed

Publication types

Substances

LinkOut - more resources