. 2009 Sep;13(9B):3497-516.
doi: 10.1111/j.1582-4934.2009.00684.x.

Control of chondrocyte gene expression by actin dynamics: a novel role of cholesterol/Ror-alpha signalling in endochondral bone growth

Affiliations

Control of chondrocyte gene expression by actin dynamics: a novel role of cholesterol/Ror-alpha signalling in endochondral bone growth

Anita Woods et al. J Cell Mol Med. 2009 Sep.

Abstract

Elucidating the signalling pathways that regulate chondrocyte differentiation, such as the actin cytoskeleton and Rho GTPases, during development is essential for understanding of pathological conditions of cartilage, such as chondrodysplasias and osteoarthritis. Manipulation of actin dynamics in tibia organ cultures isolated from E15.5 mice results in pronounced enhancement of endochondral bone growth and specific changes in growth plate architecture. Global changes in gene expression were examined of primary chondrocytes isolated from embryonic tibia, treated with the compounds cytochalasin D, jasplakinolide (actin modifiers) and the ROCK inhibitor Y27632. Cytochalasin D elicited the most pronounced response and induced many features of hypertrophic chondrocyte differentiation. Bioinformatics analyses of microarray data and expression validation by real-time PCR and immunohistochemistry resulted in the identification of the nuclear receptor retinoid related orphan receptor-alpha (Ror-alpha) as a novel putative regulator of chondrocyte hypertrophy. Expression of Ror-alpha target genes, (Lpl, fatty acid binding protein 4 [Fabp4], Cd36 and kruppel-like factor 5 [Klf15]) were induced during chondrocyte hypertrophy and by cytochalasin D and are cholesterol dependent. Stimulation of Ror-alpha by cholesterol results in increased bone growth and enlarged, rounded cells, a phenotype similar to chondrocyte hypertrophy and to the changes induced by cytochalasin D, while inhibition of cholesterol synthesis by lovastatin inhibits cytochalasin D induced bone growth. Additionally, we show that in a mouse model of cartilage specific (Col2-Cre) Rac1, inactivation results in increased Hif-1alpha (a regulator of Rora gene expression) and Ror-alpha(+) cells within hypertrophic growth plates. We provide evidence that cholesterol signalling through increased Ror-alpha expression stimulates chondrocyte hypertrophy and partially mediates responses of cartilage to actin dynamics.


Figures

Figure 1
Figure 1
Disruption of actin organization increases bone growth in organ culture and alters growth plate organization. Tibiae were isolated from E15.5 mice and incubated for a period of 6 days with DMSO vehicle, 1 μM cytochalasin D, 10 μM Y27632 or 50 nM jasplakinolide. (A) Tibiae were fixed and then stained with Alcian Blue for the detection of sulphated glycosaminoglycans and with Alizarin Red for mineral content. Data shown are representative of four independent trials, scale bar = 1 mm. (B) Lengths of tibiae were measured at the beginning and end of the 6-day culture period to determine the average longitudinal growth. All treatments result in a significant increase in longitudinal growth, but both cytochalasin D and jasplakinolide resulted in a dramatic increase in both longitudinal and appositional growth. Data shown are the average of five independent experiments, with six tibia per trial, the mean longitudinal growth ± S.E.M., *P < 0.05. (C) A subset of tibia were fixed, dehydrated, embedded in paraffin and sectioned for histological analysis of growth plate organization. Sections were stained with haematoxylin and eosin for visualization of basic histology. Data shown are representative of four independent trials, scale bar = 0.1 mm. (D) Growth plate zones were measured on the basis of cellular morphology and organization of histological sections by a blind observer. Data shown are the average of four independent experiments, four bones per trial, the length ± S.E.M., *P < 0.05. (E) Tibiae were grown in culture for a period of 6 days in the presence of vehicle, 10 μM Y27632, 1 μM cytochalasin D or 50 nM jasplakinolide. At the end of the culture period, tibiae were incubated in media containing BrdU for 4 hrs and then washed in PBS. Bones were fixed, dehydrated and embedded in paraffin, followed by sectioning and then immunohistochemistry for BrdU. Data shown are representative, scale bar = 0.1 mm.
Figure 2
Figure 2
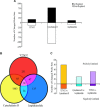
Microarray analysis of primary chondrocytes treated with actin inhibitors. An enriched population of primary mouse chondrocytes were treated with DMSO vehicle, 1 μM cytochalasin D, 10 μM Y27632 or 50 nM jasplakinolide for 24 hrs. RNA was isolated and hybridized to Affymetrix MOE 4.0 chips. Gene lists were compiled from genes that demonstrated a reliable signal (as determined by the MAS5.0 algorithm) and changed significantly; a 1.5-fold cut-off was assigned. (A) Inhibition of Rho/ROCK signalling by Y27632 resulted in 176 probe sets being up-regulated and 139 probe sets being down-regulated. Cytochalasin D treatment resulted in 777 up-regulated and 1209 down-regulated probe sets in comparison to control cultures while jasplakinolide treatment resulted in 120 probe sets being up-regulated and 107 probe sets being down-regulated. (B) Comparisons of all probe sets regulated by the three different pharmacological actin modifiers demonstrate that 14 probe sets are commonly regulated by all treatments. A total of 85 probe sets are commonly regulated by both Y27632 and cytochalasin D, 24 probe sets are commonly regulated by cytochalasin D and jasplakinolide and 47 probe sets are commonly regulated by Y27632 and jasplakinolide. (C) Commonly regulated probe sets were assessed for positive or negative correlation between treatments. Probe sets that were up-regulated or down-regulated by both treatments were assigned a positive correlation, while probe sets that were up-regulated in one treatment and down-regulated in the other were assigned a negative correlation. The majority of probe sets were positively correlated in all treatments.
Figure 3
Figure 3
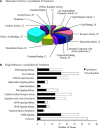
Gene ontology and Kegg pathways in response to cytochalasin D treatment. (A) Microarray gene sets from primary chondrocytes treated with 1 μM cytochalasin D for a period of 24 hrs were assessed according to GO annotations categorized by Fatigo+. (B) Kegg annotations were used to determine changes within different signalling pathways.
Figure 4
Figure 4
Comparison of cytochalasin D treatment to hypertrophic gene expression in vivo and in vitro. Microarray data sets from three different experiments were compared: (1) RNA was isolated from an enriched population of primary chondrocytes plated in high-density monolayer cultures and treated for a period of 24 hrs with DMSO vehicle or 1 μM cytochalasin D. (2) RNA was isolated from micromass cultures of differentiating chondrocytes on day 3 and day 15 of culture. (3) RNA was isolated from E15.5 tibiae that were microdissected into different growth plate zones. All experiments were run in triplicate for each treatment or time-point. RNAs were hybridized to Affymetrix chips for the micromass arrays we used different chips, raw data were imported into Genespring7.3.1 and gene lists were generated from those probe sets that demonstrate a reliable signal as determined by M.A.S. 5.0 and that changed significantly as determined by a one-way ANOVA. A cut-off of 1.5-fold change was implemented and those probe sets that were significantly up-regulated by 1.5-fold in cytochalasin D treatment versus DMSO control, 1.5-fold up-regulated in the hypertrophic region of the growth plate versus the resting zone and 1.5-fold up-regulated on day 15 of micromass culture versus day 3 of culture were compared. A total of 56 probe sets were commonly regulated in all three models. A total of 426 probe sets were commonly regulated in the microdissected hypertrophic growth plate versus the differentiated micromass culture. A total of 203 probe sets were commonly regulated in differentiated micromass culture and cytochalasin D treatment and 128 probe sets were commonly regulated in the cytochalasin D treatment versus the hypertrophic growth plate.
Figure 5
Figure 5
Real-time validations of selected genes changing in response to actin inhibitors RNA isolated from an enriched population primary chondrocytes plated in high-density monolayer for a period of 24 hrs with vehicle control, 1 μM cytochalasin D, 10 μM Y27632 or 50 nM jasplakinolide were assessed by real-time PCR. (A) Rora mRNA levels are significantly increased by both cytochalasin D and jasplakinolide treatment in comparison to the vehicle control. Y27632 treatment results in a significant decrease in Rora mRNA levels. (B) Lcp1 mRNA levels are significantly increased in response to all treatments in comparison to control cultures. (C) Relative gene expression of Frzb is significantly increased with cytochalasin D treatment but is unaffected with either jasplakinolide or Y27632 treatment. (D) Gdf10 mRNA levels are significantly increased with both cytochalasin D and Y27632 treatment. Data shown are the average of three independent trials run in quadruplicated, the relative gene expression ± S.E., *P < 0.05.
Figure 6
Figure 6
Ror-α and Hif-1α expression pattern in the growth plate. (A) Paraffin-embedded sections from tibia organ cultures were analysed for Ror-α protein expression by immunohistochemistry. Ror-α protein levels are highest in the pre-hypertrophic and hypertrophic regions of control sections, but high throughout the growth plate of cytochalasin D treated bones. Data shown are representative of 3 independent trials, scale bar = 0.1 mm. (B) Paraffin embedded sections were analysed for Hif-1α protein expression. Hif-1α protein levels are highest in the pre-hypertrophic and hypertrophic region of control sections. In sections from tibia treated with 1 μM cytochalasin D, Hif-1α expression was found throughout the growth plate. Data shown are representative of 3 independent trials, scale bar = 0.1 mm. (C) Tibiae were isolated from newborn control (wild-type) and cartilage-specific Rac1 deficient (knockdown [KD]) animals, Col2-Cre Rac1fl/fl mice. Paraffin embedded sections were analysed for Hif-1α and Ror-α protein expression. Hif-1α protein levels are highest in the lower portion of the proliferative zone and upper portion of the hypertrophic zone. In Rac1 knockdown tibiae, the zone of Hif-1α expression was expanded. Similarly, expression of Ror-α is highest in the pre-hypertrophic region of the growth in control tibiae. The number of cells expressing Ror-α in Rac1 knockdown animals is increased, scale bar = 0.1 mm.
Figure 7
Figure 7
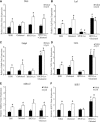
Functional validations of genes up-regulated by cytochalasin D treatment and some known targets of Ror-α signalling. RNA was isolated from an enriched population of primary chondrocytes plated in high-density monolayer culture that were pre-treated for 4 hrs with 10 mM HPCD or ethanol. After media were changed, cells were treated with vehicle control, 10 μM cholesterol, 5 μM lovastatin and/or 1 μM cytochalasin D. (A) Rora gene expression was determined by real-time PCR. Cytochalasin D treatment increased mRNA levels of Rora independent of increased or decreased levels of cholesterol. (B) Lpl mRNA levels were significantly increased by cytochalasin D treatment which was inhibited by the addition of HPCD and lovastatin. Lpl gene expression was rescued by the addition of cholesterol to HPCD and lovastatin treatment. (C) Fabp4 gene expression is increased with cytochalasin D treatment and this increase was inhibited by HPCD and lovastatin treatment. Fabp4 gene expression was rescued by the addition of cholesterol. (D) Cd36 gene expression was increased by cytochalasin D treatment and this increase was inhibited by HPCD and lovastatin treatment. The addition of cholesterol in the presence of HPCD and lovastatin resulted in an increase of Cd36 gene expression. (E) Aldh1a3 is not a known target of Ror-α signalling. Aldh1a3 gene expression was increased by cytochalasin D treatment but not affected by the inhibition or addition of cholesterol. (F) Klf15 gene expression was significantly increased by cytochalasin D treatment; this increase was inhibited by the treatment of HPCD and lovastatin and then rescued by the addition of cholesterol. Relative gene expression was determined by comparing gene expression to Gapdh. Data shown are an average of three independent experiments run in quadruplicate, the mean relative gene expression ± S.E.M., *P < 0.05 between the vehicle and cytochalasin D treatment, and #P < 0.05 within the vehicle treatment and the addition or removal of cholesterol.
Figure 8
Figure 8
Longitudinal growth of organ cultures treated with cholesterol and/or inhibition of cholesterol synthesis. (A) E15.5 tibiae were grown for a period of 6 days in culture and treated every other day. Subsets of tibiae were pre-treated for a period of 4 hrs with 10 mM HPCD. Remaining tibiae were then treated with vehicle, 1 μM cytochalasin D, 10 μM cholesterol and/or 5 μM lovastatin (HPCD pre-treated tibiae). Bones were fixed and then stained with Alcian Blue/Alizarin Red. Data shown are representative of 3 independent trials, scale bar = 1 mm. (B) Tibiae were measured on day 1 of culture and then at the end of 6 days for assessment of longitudinal growth. Tibiae treated with cytochalasin D, cholesterol or a combination of both grew significantly longer than the control. Inhibition of cholesterol signalling by HPCD pre-treatment followed by lovastatin treatment resulted in significantly shorter bones, which could be rescued by exogenous cholesterol but not by cytochalasin D. Data shown are an average of 3 independent trials run in triplicate, ±S.E.M., *P < 0.05.
Figure 9
Figure 9
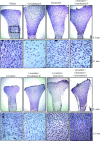
Growth plate morphology of cholesterol treated tibia. After 6 days in culture, treated tibiae were embedded in paraffin and sectioned. Growth plates were stained with haematoxylin for visualization of growth plate organization. Growth plates were treated with cholesterol and in combination with cytochalasin D or cholesterol synthesis was inhibited by HPCD pre-treatment followed by lovastatin and in combination with cholesterol and cytochalasin D. Growth plates treated with cholesterol showed larger, more rounded cells throughout the growth plate; however, they still exhibited organized growth plate zones. Inhibition of cholesterol synthesis also resulted in rounded cellular morphology, except the chondrocytes looked much smaller and no hypertrophic zone was observed. Cytochalasin D treatment was unable to rescue the effects of lovastatin and HPCD treatment. However, addition of cholesterol was able to rescue the phenotype, and growth plate zones were clearly distinguishable. Data shown are representative, scale bar = 0.1 mm.
Figure 10
Figure 10
Summary. Our studies suggest that a gene expressed during chondrocyte differentiation to hypertrophy, Ror-α, regulates the expression of Fabp4, Klf15, Cd36 and Lpl in a cholesterol dependent manner. Inhibition of actin polymerization by cytochalasin D or inhibition of Rac1 signalling promotes Ror-α expression levels. The regulation of Ror-α expression levels is likely mediated via Hif-1α, a known regulator of Ror-α.

Similar articles

Cited by

References

    1. Hunziker EB. Mechanism of longitudinal bone growth and its regulation by growth plate chondrocytes. Microsc Res Tech. 1994;28:505–19. - PubMed
    1. Noonan KJ, Hunziker EB, Nessler J, et al. Changes in cell, matrix compartment, and fibrillar collagen volumes between growth-plate zones. J Orthop Res. 1998;16:500–8. - PubMed
    1. Abad V, Meyers JL, Weise M, et al. The role of the resting zone in growth plate chondrogenesis. Endocrinology. 2002;143:1851–7. - PubMed
    1. Hunziker EB, Schenk RK, Cruz-Orive LM. Quantitation of chondrocyte performance in growth-plate cartilage during longitudinal bone growth. J Bone Joint Surg Am. 1987;69:162–73. - PubMed
    1. Wilsman NJ, Farnum CE, Leiferman EM, et al. Differential growth by growth plates as a function of multiple parameters of chondrocytic kinetics. J Orthop Res. 1996;14:927–36. - PubMed

Publication types