. 2009 Sep;13(9B):3939-50.
doi: 10.1111/j.1582-4934.2009.00685.x.

Interferon regulatory factor-8 modulates the development of tumour-induced CD11b+Gr-1+ myeloid cells

Affiliations

Interferon regulatory factor-8 modulates the development of tumour-induced CD11b+Gr-1+ myeloid cells

Trina J Stewart et al. J Cell Mol Med. 2009 Sep.

Abstract

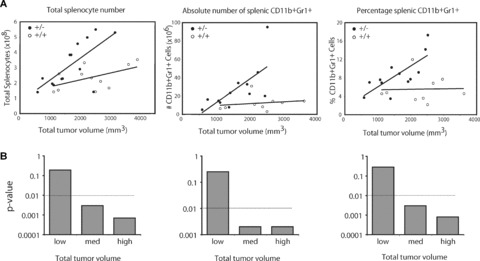
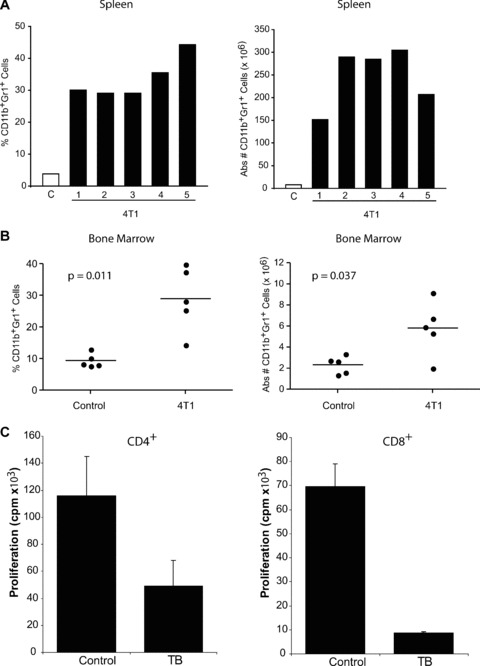
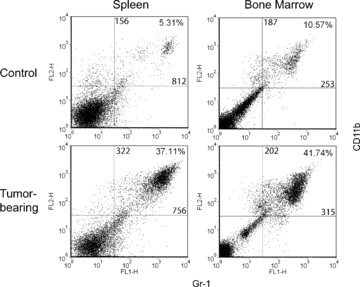
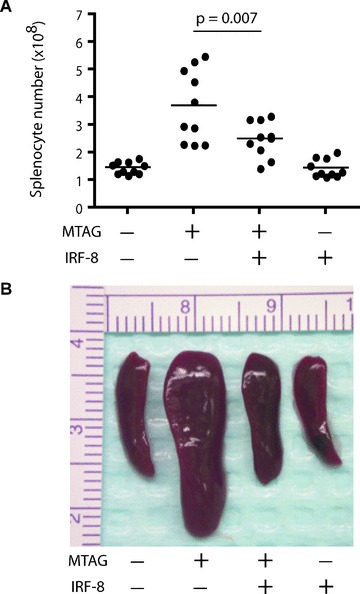
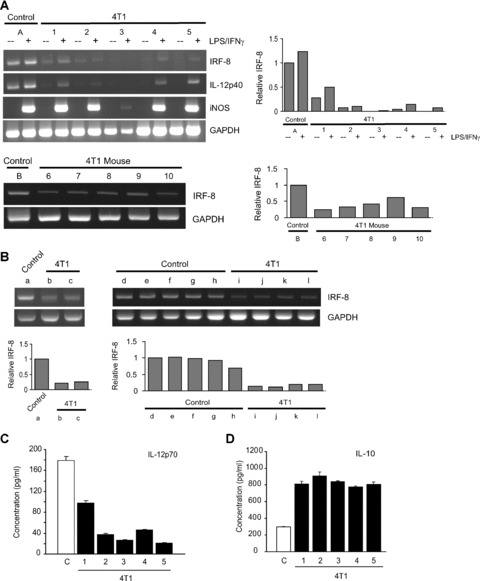
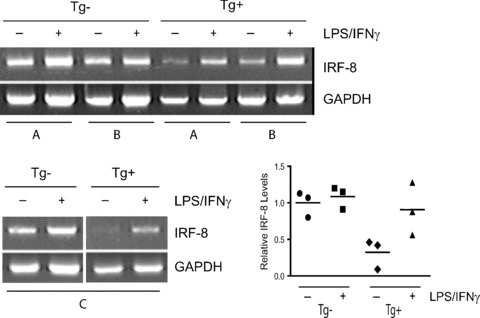
Tumour-induced myeloid-derived suppressor cells (MDSC) promote immune suppression and mediate tumour progression. However, the molecular basis for the generation of MDSC, which in mice co-express the CD11b(+) and Gr-1(+) cell surface markers remains unclear. Because CD11b(+)Gr-1(+) cells expand during progressive tumour growth, this suggests that tumour-induced events alter signalling pathways that affect normal myeloid cell development. Interferon regulatory factor-8 (IRF-8), a member of the IFN-gamma regulatory factor family, is essential for normal myelopoiesis. We therefore examined whether IRF-8 modulated tumour-induced CD11b(+)Gr-1(+) cell development or accumulation using both implantable (4T1) and transgenic (MMTV-PyMT) mouse models of mammary tumour growth. In the 4T1 model, both splenic and bone marrow-derived CD11b(+)Gr-1(+) cells of tumour-bearing mice displayed a marked reduction in IRF-8 expression compared to control populations. A causal link between IRF-8 expression and the emergence of tumour-induced CD11b(+)Gr-1(+) cells was explored in vivo using a double transgenic (dTg) mouse model designed to express transgenes for both IRF-8 and mammary carcinoma development. Despite the fact that tumour growth was unaffected, splenomegaly, as well as the frequencies and absolute numbers of CD11b(+)Gr-1(+) cells were significantly lower in dTg mice when compared with single transgenic tumour-bearing mice. Overall, these data reveal that IRF-8 plays an important role in tumour-induced development and/or accumulation of CD11b(+)Gr-1(+) cells, and establishes a molecular basis for the potential manipulation of these myeloid populations for cancer therapy.


Figures

Figure 6
Figure 6
Transgenic expression of IRF-8 reduces splenic CD11b+Gr-1+ cells in a spontaneous tumour model of mammary carcinoma. (A): The role of IRF-8 in the production of tumour-induced CD11b+Gr-1+ cells was analysed in a dTg mouse model as described in Fig. 5. Here, tumour-bearing sTg MTAG mice (denoted as ‘+/–’) were compared to dTg mice (denoted as ‘+/+’) for changes in the percentages and absolute numbers of splenic CD11b+Gr-1+ cells, as well as total splenocytes as a function of overall tumour load. As noted in Fig. 5, since transgenic expression of IRF-8 had no significant impact on tumour growth in dTg mice, both sTg and dTg groups were compared in an age- and littermate-matched fashion. It is also important to note that alterations in these haematopoietic parameters were not observed in IRF-8 sTg mice as compared to wild-type mice (not shown). Each data point represents data from an individual mouse. (B) Statistical summary of the data illustrated in the (A), whereby ‘low, med (medium) and high’ overall tumour loads reflected tumour volumes of approximately 1300, 2000 and 2500 mm3, respectively, in sTg and dTg mice. Horizontal dashed line represents the statistical cut-off.
Figure 1
Figure 1
Accumulation of CD11b+Gr-1+ cells in 4T1 tumour-bearing mice. 4T1 mammary tumour cells (5 × 10⁴/mouse) were injected orthotopically in five individual female CB6F1/J (H-2b/d) mice. Control (denoted as ‘C’) mice did not receive a tumour injection. Upon reaching the ethical limit of 2 cm3 tumour volume (at day 26), all mice were euthanized, and splenocytes recovered for enumeration. (A, left panel) Unfractionated splenocytes were evaluated for the percentage of CD11b+Gr-1+ cells using two-colour flow cytometry. (A, right panel) Absolute numbers of CD11b+Gr-1+ cells were calculated by multiplying the percentages determined in (A) by total splenocyte counts. For both panels, splenocytes from the control group were pooled and an average result determined, whereas splenocytes from the 4T1 tumour-bearing mice were analysed separately. Comparable results were observed when BALB/c mice were similarly challenged with 4T1 cells. In a separate experiment, the percentages (B, left panel) and absolute numbers (B, right panel) of CD11b+Gr-1+ cells were determined, as described above from unfractionated bone marrow cells of control and 4T1 tumour-bearing mice. Each data point represents the results of an individual mouse. (C) Splenic CD4+ or CD8+ T cells were purified from non-tumour-bearing wild-type (WT) CB6F1/J mice. T cells were mixed with CD11b+Gr-1+ cells purified from the spleens of either WT or 4T1 tumour-bearing (TB) CB6F1/J mice (1:1 ratio). In the case of the control group, both T cells and CD11b+Gr-1+ cells were obtained from the same mouse. In the case of tumour-induced CD11b+Gr-1+ cells, T cells from a wild-type mouse were used to avoid any in vivo tumour-induced effect on T-cell function. Cultures were then incubated in the absence or presence of immobilized anti-CD3 mAb for 48 hrs. Proliferation was measured by 3H-thymidine uptake after an additional 24 hrs of incubation. Results represent the mean ± S.E.M. of triplicate wells.
Figure 2
Figure 2
Flow cytometric analysis of CD11b+Gr-1+ cells from both spleen and bone marrow of control and 4T1 tumour-bearing mice. Representative two-colour dot plots for the percentages and MFI values of CD11b+Gr-1+ cells derived from Fig. 1. The percentages and MFI values for two-colour staining are shown in the upper right quadrant. The MFI values for CD11b and Gr-1 staining are shown along the vertical and horizontal lines within the upper right quadrant, respectively. Data are representative of at least five separate mice per group.
Figure 5
Figure 5
Transgenic expression of IRF-8 reduces splenomegaly in a spontaneous tumour model of mammary carcinoma. (A): The role of IRF-8 on tumour-induced splenomegaly was analysed in a dTg mouse model designed to express the transgenes for both IRF-8 and MMTV-PyMT (denoted as MTAG). Four possible genotypes were produced as a result of mating the two heterozygous sTg mouse colonies. Transgenic expression of IRF-8 did not significantly affect primary tumour growth in dTg mice (2240 ± 268 mm3; mean ± S.E.M. of 10 separate mice), compared with sTg MTAG mice (1950 ± 179 mm3; n= 10). Mice were then killed and splenocyte counts determined alongside age- and (in most cases) littermate-matched double-negative (wild-type) or sTg IRF-8 cohorts. Each data point represents total splenocyte counts from an individual mouse. (B) Photographic illustration of a representative spleen of 10 mice, reflecting the four different genotypes.
Figure 3
Figure 3
IRF-8 expression is down-regulated in 4T1 tumour-induced CD11b+Gr-1+ cells. CD11b+Gr-1+ cells from the control and 4T1 tumour-bearing groups of mice shown in Fig. 1 were analysed for the expression of the indicated genes by RT-PCR (upper set of genes corresponds to A). CD11b+Gr-1+ cells were first purified by CD11b-magnetic bead cell separation, and incubated overnight in the absence (−) or presence (+) of IFN-γ (100 U/ml) plus LPS (1 μg/ml). (Mouse #3 showed a weak response to iNOS induction, but responded as well as the other 4T1-tumour-bearing mice in terms of IL-10 production; see D). (Lower gel of A) In a separate experiment, IRF-8 expression levels were determined, as described above, from a control group (‘B’) and five individual tumour-bearing mice (‘6–10’). Control CD11b+Gr-1+ cells were first collected from a pool of splenocytes, whereas CD11b+Gr-1+ cells from 4T1 tumour-bearing mice were isolated from individual mice. Experiments were repeated in BALB/c mice with similar results. (B) IRF-8 expression levels of CD11b+Gr-1+ cells purified from bone marrow of control (a; d–h) and 4T1 tumour-bearing CB6F1/J mice (b, c; i–l), as in (A). The results are summarized from two independent experiments shown as, ‘a–c’ and ‘d–l’. Samples shown as ‘d–l’ represent data from individual mice, whereas samples shown as ‘a, b and c’ represent data from pools of five, two and two mice, respectively. The relative levels of IRF-8 shown in (A) and (B) were quantified by analysis of the PCR band intensities, as described in the ‘Materials and methods’. The first lane of each of the four gels was arbitrarily set at a relative intensity of 1. (C and D) Tumour-induced CD11b+Gr-1+ cells also displayed an altered IL-12/IL-10 profile. CD11b+Gr-1+ cells of the same control (‘C’) and 4T1 tumour-bearing groups shown in (A) were also analysed for production of IL-12 (IL-12p70) and IL-10 following stimulation with IFN-γ and LPS overnight. Cytokines were undetectable in the absence of stimulation (not shown). Data represent the mean ± S.E.M. of triplicate determinations for cytokine concentration from each preparation. Experiments were repeated in BALB/c mice with similar results.
Figure 4
Figure 4
IRF-8 expression is reduced in CD11b+Gr-1+ cells derived from tumour-bearing MTAG mice. CD11b+Gr-1+ cells from control and tumour-bearing MTAG mice were analysed for basal and inducible IRF-8 expression levels, as in Fig. 2. CD11b+Gr-1+ cells were purified and then incubated overnight in the absence (−) or presence (+) of IFN-γ plus LPS. Here, three separate pairs of age-matched control (‘Tg’) and tumour-bearing MTAG mice (‘Tg+’) (total tumour volume of each mouse, ≥2 cm3), was assessed, indicated as pairs (A), (B) (upper gel) or (C) (lower gel). (Lower right panel) The relative levels of IRF-8 shown for mouse pairs (A)–(C) were then quantified by analysis of the PCR band intensities, as in Fig. 2. We divided (or standardized) each individual ratio (IRF-8/β-actin) by the mean ratio of the Tg- group (without in vitro treatment) to yield a relative ratio. The graph depicts the relative ratio for each of the twelve observations (n= 3 corresponding to groups A, B and C/in vitro treatment). The horizontal lines indicate the means of the standardized values.

Similar articles

Cited by

References

    1. Wang T, Niu G, Kortylewski M, et al. Regulation of the innate and adaptive immune responses by Stat-3 signaling in tumor cells. Nature Med. 2004;10:48–54. - PubMed
    1. Rabinovich GA, Gabrilovich D, Sotomayor EM. Immunosuppressive strategies that are mediated by tumor cells. Annu Rev Immunol. 2007;25:267–96. - PMC - PubMed
    1. Stewart TJ, Greeneltch KM, Lutsiak ME, et al. Immunological responses can have both pro- and antitumour effects: implications for immunotherapy. Expert Rev Mol Med. 2007;9:1–20. - PubMed
    1. Nagaraj S, Gabrilovich DI. Myeloid-derived suppressor cells. Adv Exp Med Biol. 2007;601:213–23. - PubMed
    1. Kusmartsev S, Gabrilovich DI. Role of immature myeloid cells in mechanisms of immune evasion in cancer. Cancer Immunol Immunother. 2006;55:237–45. - PMC - PubMed

Publication types

MeSH terms