

Pregnane X Receptor (PXR) expression in colorectal cancer cells restricts irinotecan chemosensitivity through enhanced SN-38 glucuronidation
- PMID: 20196838
- PMCID: PMC2838814
- DOI: 10.1186/1476-4598-9-46
Pregnane X Receptor (PXR) expression in colorectal cancer cells restricts irinotecan chemosensitivity through enhanced SN-38 glucuronidation
Abstract
Background: Clinical efficacy of chemotherapy in colorectal cancer is subjected to broad inter-individual variations leading to the inability to predict outcome and toxicity. The topoisomerase I inhibitor irinotecan (CPT-11) is worldwide approved for the treatment of metastatic colorectal cancer and undergoes extensive peripheral and tumoral metabolism. PXR is a xenoreceptor activated by many drugs and environmental compounds regulating the expression of drug metabolism and transport genes in detoxification organs such as liver and gastrointestinal tract. Considering the metabolic pathway of irinotecan and the tissue distribution of Pregnane x Receptor (PXR), we hypothesized that PXR could play a key role in colon cancer cell response to irinotecan.
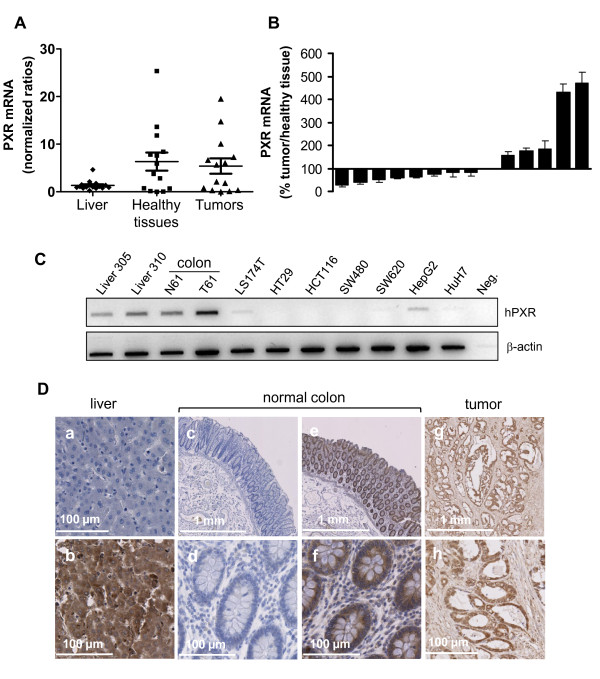
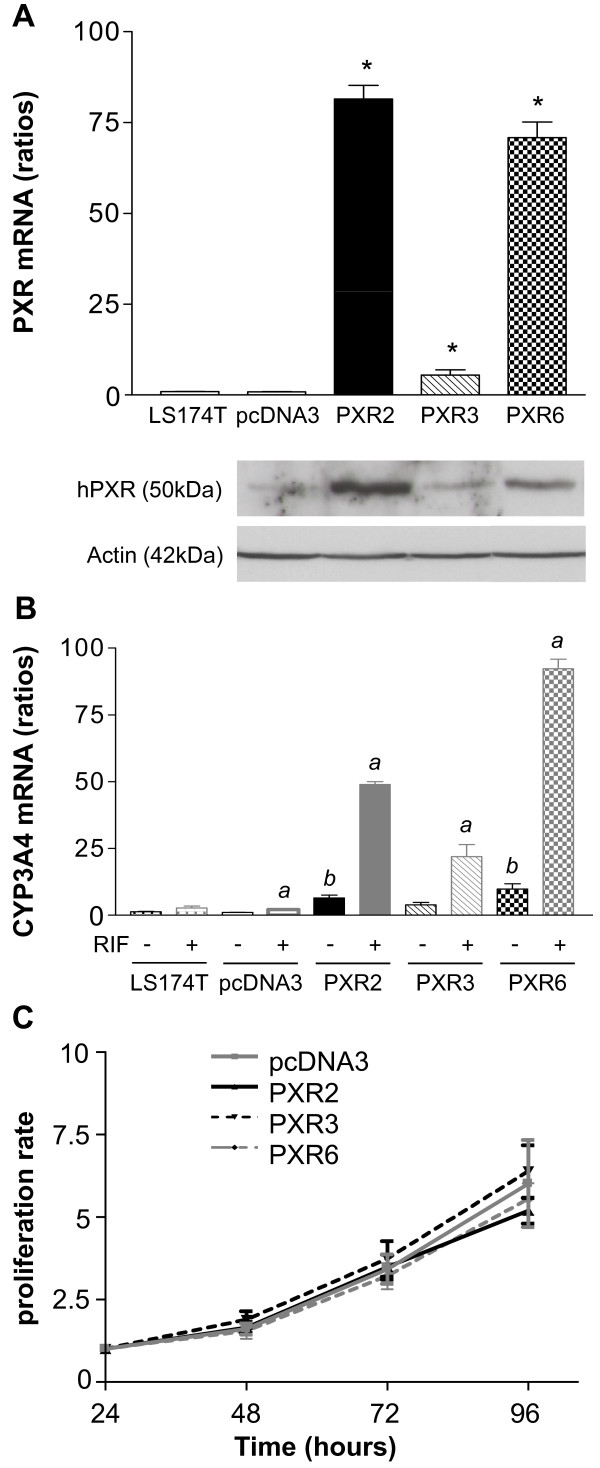
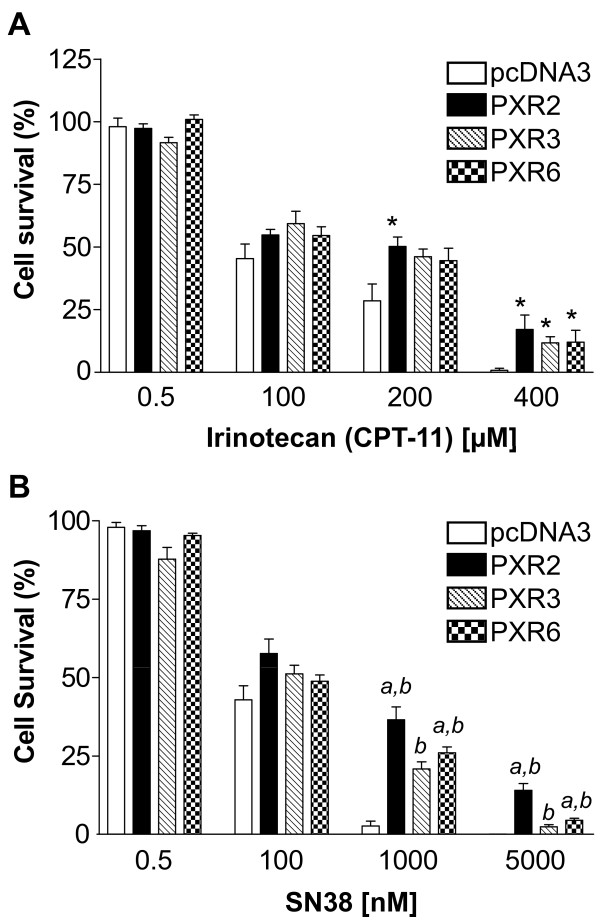
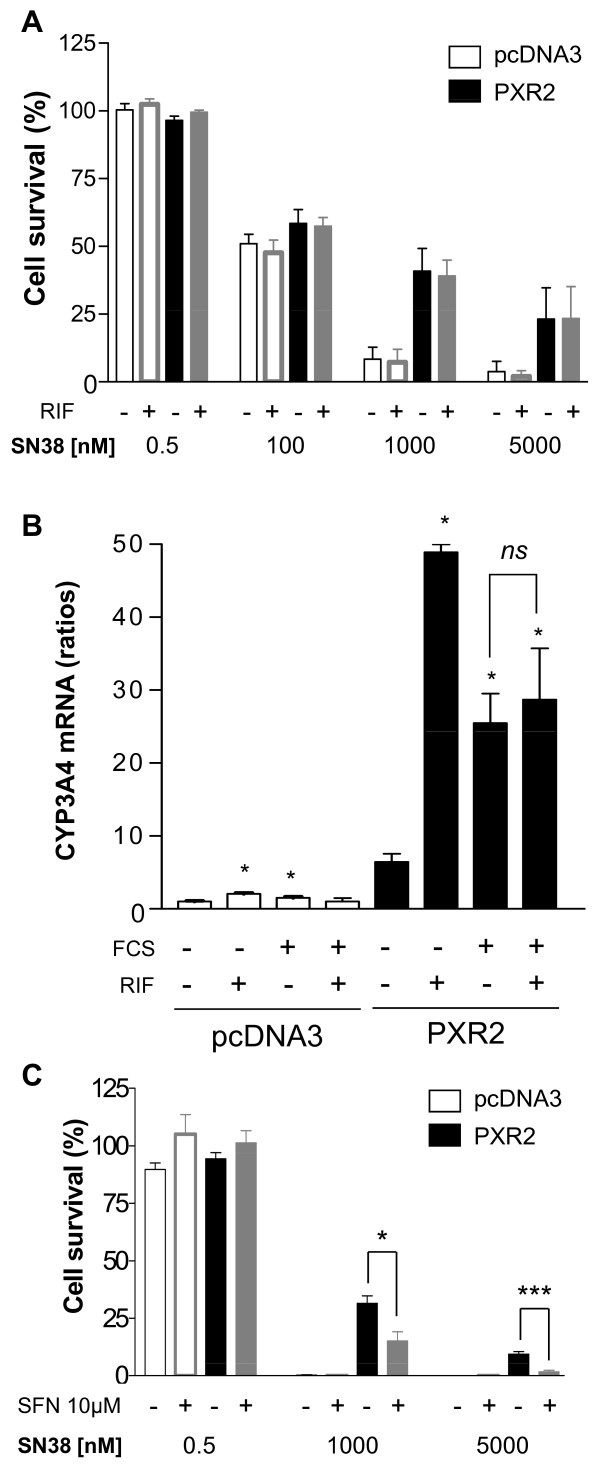
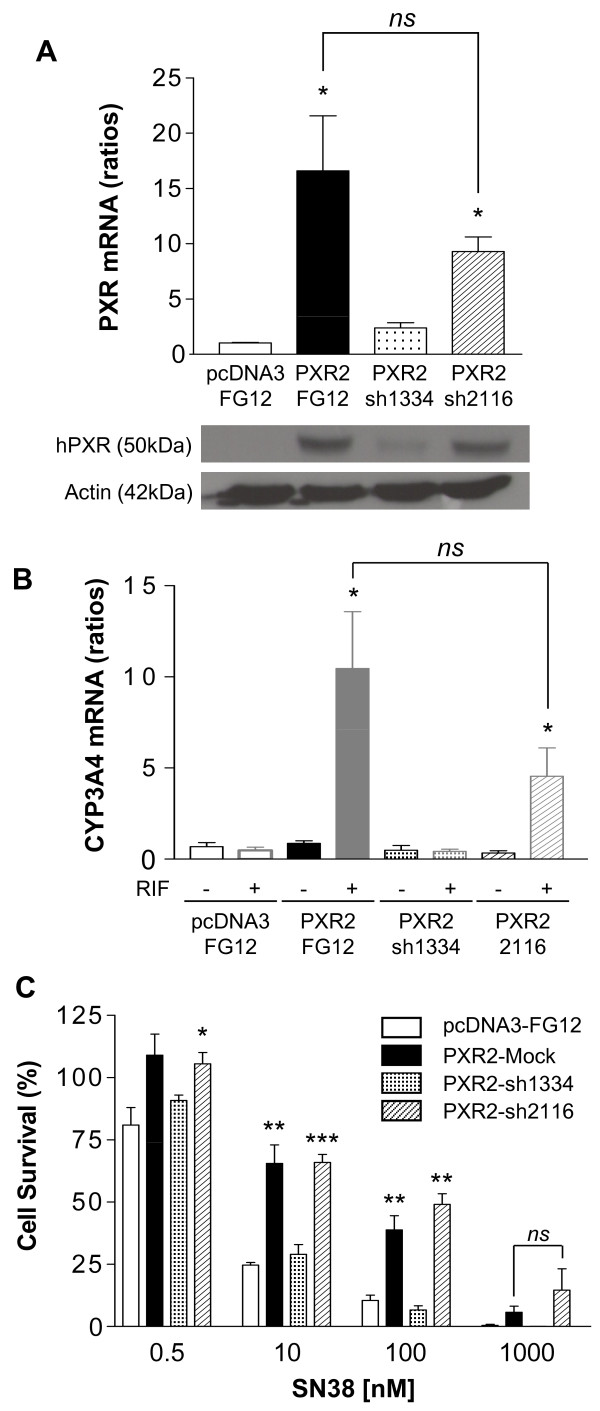
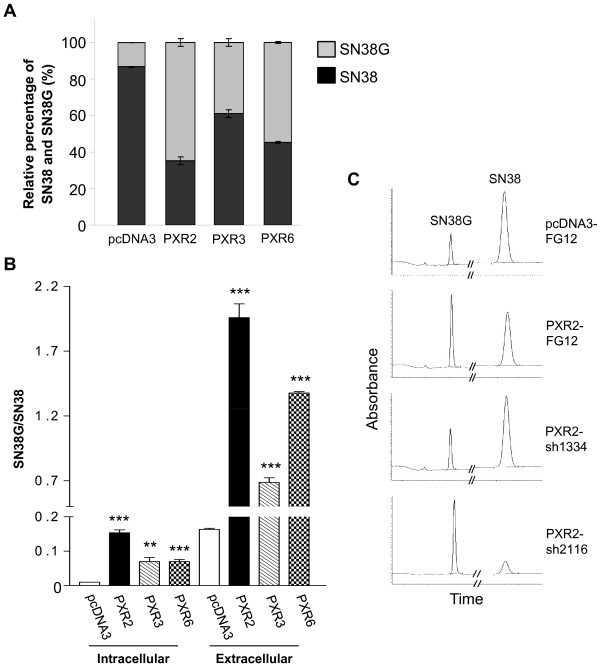
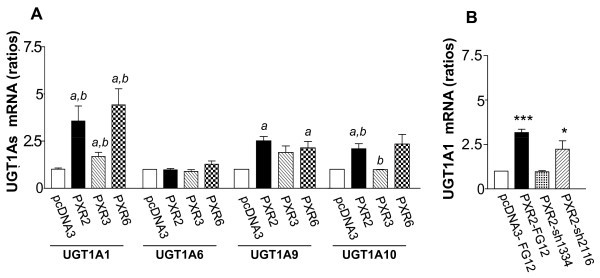
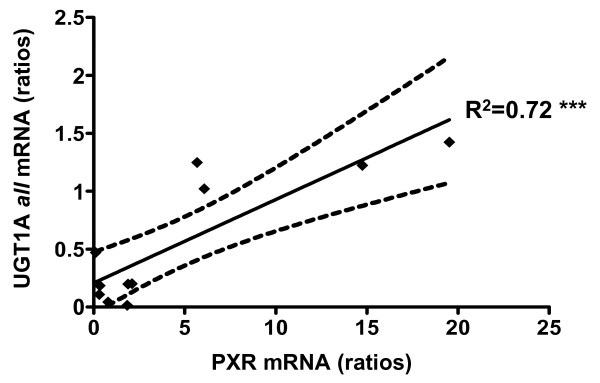
Results: PXR mRNA expression was quantified by RT-quantitative PCR in a panel of 14 colon tumor samples and their matched normal tissues. PXR expression was modulated in human colorectal cancer cells LS174T, SW480 and SW620 by transfection and siRNA strategies. Cellular response to irinotecan and its active metabolic SN38 was assessed by cell viability assays, HPLC metabolic profiles and mRNA quantification of PXR target genes. We showed that PXR was strongly expressed in colon tumor samples and displayed a great variability of expression. Expression of hPXR in human colorectal cancer cells led to a marked chemoresistance to the active metabolite SN38 correlated with PXR expression level. Metabolic profiles of SN38 showed a strong enhancement of SN38 glucuronidation to the inactive SN38G metabolite in PXR-expressing cells, correlated with an increase of UDPglucuronosyl transferases UGT1A1, UGT1A9 and UGT1A10 mRNAs. Inhibition of PXR expression by lentivirus-mediated shRNA, led to SN38 chemoresistance reversion concomitantly to a decrease of UGT1A1 expression and SN38 glucuronidation. Similarly, PXR mRNA expression levels correlated to UGT1A subfamily expression in human colon tumor biopsies.
Conclusion: Our results demonstrate that tumoral metabolism of SN38 is affected by PXR and point to potential therapeutic significance of PXR quantification in the prediction of irinotecan response. Furthermore, our observations are pharmacologically relevant since many patients suffering from cancer diseases are often exposed to co-medications, food additives or herbal supplements able to activate PXR. A substantial part of the variability observed among patients might be caused by such interactions.
Figures
Similar articles
-
Role of pregnane X receptor in chemotherapeutic treatment.Cancer Chemother Pharmacol. 2014 Aug;74(2):217-27. doi: 10.1007/s00280-014-2494-9. Epub 2014 Jun 3. Cancer Chemother Pharmacol. 2014. PMID: 24889719 Free PMC article. Review.
-
Regulation of pregnane X receptor (PXR) function and UGT1A1 gene expression by posttranslational modification of PXR protein.Drug Metab Dispos. 2012 Oct;40(10):2031-40. doi: 10.1124/dmd.112.046748. Epub 2012 Jul 24. Drug Metab Dispos. 2012. PMID: 22829544
-
The role of UGT1A1*28 polymorphism in the pharmacodynamics and pharmacokinetics of irinotecan in patients with metastatic colorectal cancer.J Clin Oncol. 2006 Jul 1;24(19):3061-8. doi: 10.1200/JCO.2005.05.5400. J Clin Oncol. 2006. PMID: 16809730 Clinical Trial.
-
ATP citrate lyase mediates resistance of colorectal cancer cells to SN38.Mol Cancer Ther. 2013 Dec;12(12):2782-91. doi: 10.1158/1535-7163.MCT-13-0098. Epub 2013 Oct 16. Mol Cancer Ther. 2013. PMID: 24132143 Free PMC article.
-
Pharmacogenetics of uridine diphosphoglucuronosyltransferase (UGT) 1A family members and its role in patient response to irinotecan.Drug Metab Rev. 2006;38(3):393-409. doi: 10.1080/03602530600739835. Drug Metab Rev. 2006. PMID: 16877259 Review.
Cited by
-
PXR antagonists and implication in drug metabolism.Drug Metab Rev. 2013 Feb;45(1):60-72. doi: 10.3109/03602532.2012.746363. Drug Metab Rev. 2013. PMID: 23330542 Free PMC article. Review.
-
Role of PXR in Hepatic Cancer: Its Influences on Liver Detoxification Capacity and Cancer Progression.PLoS One. 2016 Oct 19;11(10):e0164087. doi: 10.1371/journal.pone.0164087. eCollection 2016. PLoS One. 2016. PMID: 27760163 Free PMC article.
-
Gefitinib Inhibits Rifampicin-Induced CYP3A4 Gene Expression in Human Hepatocytes.ACS Omega. 2022 Sep 13;7(38):34034-34044. doi: 10.1021/acsomega.2c03270. eCollection 2022 Sep 27. ACS Omega. 2022. PMID: 36188260 Free PMC article.
-
Role of pregnane X receptor in chemotherapeutic treatment.Cancer Chemother Pharmacol. 2014 Aug;74(2):217-27. doi: 10.1007/s00280-014-2494-9. Epub 2014 Jun 3. Cancer Chemother Pharmacol. 2014. PMID: 24889719 Free PMC article. Review.
-
Pregnane X receptor activation induces FGF19-dependent tumor aggressiveness in humans and mice.J Clin Invest. 2011 Aug;121(8):3220-32. doi: 10.1172/JCI41514. Epub 2011 Jul 11. J Clin Invest. 2011. PMID: 21747170 Free PMC article.
References
-
- Mathijssen RH, van Alphen RJ, Verweij J, Loos WJ, Nooter K, Stoter G, Sparreboom A. Clinical pharmacokinetics and metabolism of irinotecan (CPT-11) Clin Cancer Res. 2001;7:2182–2194. - PubMed
Publication types
MeSH terms
Substances
LinkOut - more resources
Full Text Sources
Other Literature Sources
Medical
