

End-tidal and arterial carbon dioxide measurements correlate across all levels of physiologic dead space
- PMID: 20196877
- PMCID: PMC2837928
End-tidal and arterial carbon dioxide measurements correlate across all levels of physiologic dead space
Abstract
Background: End-tidal carbon dioxide (P(ETCO(2))) is a surrogate, noninvasive measurement of arterial carbon dioxide (P(aCO(2))), but the clinical applicability of P(ETCO(2)) in the intensive care unit remains unclear. Available research on the relationship between P(ETCO(2)) and P(aCO(2)) has not taken a detailed assessment of physiologic dead space into consideration. We hypothesized that P(ETCO(2)) would reliably predict P(aCO(2)) across all levels of physiologic dead space, provided that the expected P(ETCO(2))-P(aCO(2)) difference is considered.
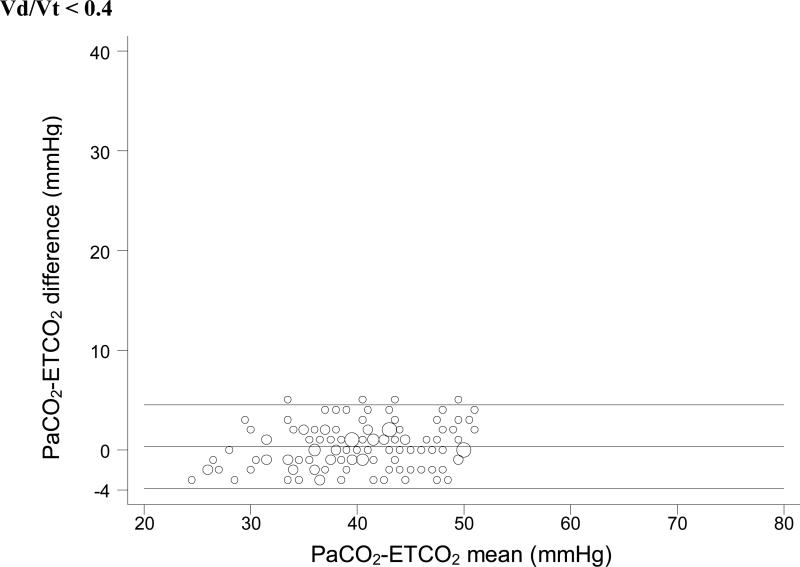
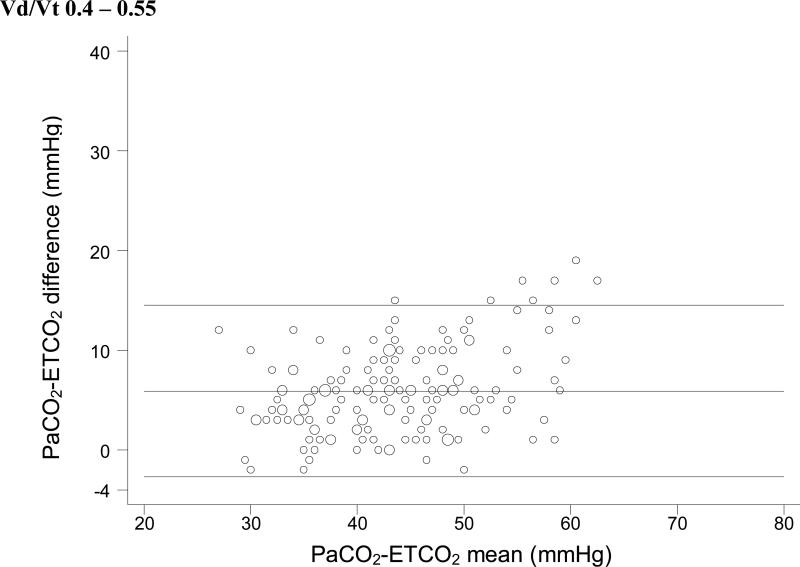
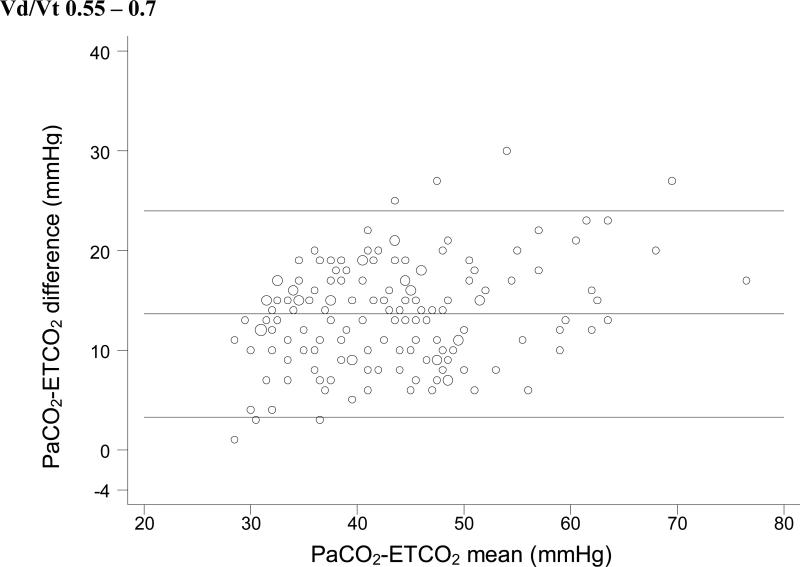
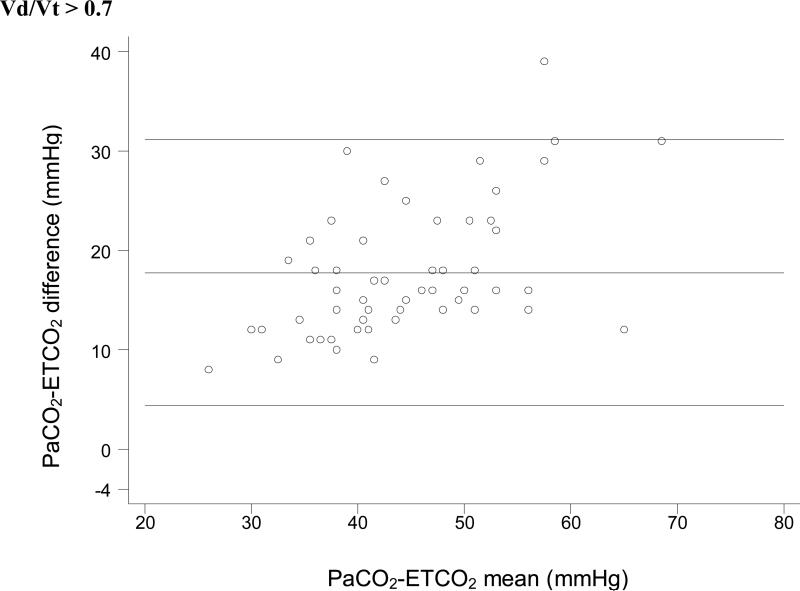
Methods: Fifty-six mechanically ventilated pediatric patients (0-17 y old, mean weight 19.5 +/- 24.5 kg) were monitored with volumetric capnography. For every arterial blood gas measurement during routine care, we measured P(ETCO(2)) and calculated the ratio of dead space to tidal volume (V(D)/V(T)). We assessed the P(ETCO(2))-P(aCO(2)) relationship with Pearson's correlation coefficient, in 4 V(D)/V(T) ranges.
Results: V(D)/V(T) was <or= 0.40 for 125 measurements (25%), 0.41-0.55 for 160 measurements (32%), 0.56-0.70 for 154 measurements (31%), and >0.7 for 54 measurements (11%). The correlation coefficients between P(ETCO(2)) and P(aCO(2)) were 0.95 (mean difference 0.3 +/- 2.1 mm Hg) for V(D)/V(T) <or= 0.40, 0.88 (mean difference 5.9 +/- 4.3 mm Hg) for V(D)/V(T) 0.41-0.55, 0.86 (mean difference 13.6 +/- 5.2 mm Hg) for V(D)/V(T) 0.56-0.70, and 0.78 (mean difference 17.8 +/- 6.7 mm Hg) for V(D)/V(T) >0.7.
Conclusions: There were strong correlations between P(ETCO(2)) and P(aCO(2)) in all the V(D)/V(T) ranges. The P(ETCO(2))-P(aCO(2)) difference increased predictably with increasing V(D)/V(T).
Figures
Comment in
-
Measuring dead space: does it really matter? or, What are we waiting for?Respir Care. 2010 Mar;55(3):350-2. Respir Care. 2010. PMID: 20196887 No abstract available.
Similar articles
-
Capnometry after an inspiratory breath hold, PLAT CO2 , as a surrogate for in mild to moderate pediatric acute respiratory distress syndrome: A feasibility study.Pediatr Pulmonol. 2023 Oct;58(10):2899-2905. doi: 10.1002/ppul.26610. Epub 2023 Aug 18. Pediatr Pulmonol. 2023. PMID: 37594148
-
Sidestream microstream end tidal carbon dioxide measurements and blood gas correlations in neonatal intensive care unit.Pediatr Pulmonol. 2013 Mar;48(3):250-6. doi: 10.1002/ppul.22593. Epub 2012 May 15. Pediatr Pulmonol. 2013. PMID: 22589000
-
Monitoring Dead Space in Mechanically Ventilated Children: Volumetric Capnography Versus Time-Based Capnography.Respir Care. 2015 Nov;60(11):1548-55. doi: 10.4187/respcare.03892. Epub 2015 Jul 21. Respir Care. 2015. PMID: 26199451
-
Volume Capnography in the Intensive Care Unit: Physiological Principles, Measurements, and Calculations.Ann Am Thorac Soc. 2019 Mar;16(3):291-300. doi: 10.1513/AnnalsATS.201807-501CME. Ann Am Thorac Soc. 2019. PMID: 30657700 Review.
-
Volume Capnography in the Intensive Care Unit: Potential Clinical Applications.Ann Am Thorac Soc. 2019 Apr;16(4):409-420. doi: 10.1513/AnnalsATS.201807-502CME. Ann Am Thorac Soc. 2019. PMID: 30742490 Review.
Cited by
-
Cyclooxygenase-derived vasoconstriction restrains hypoxia-mediated cerebral vasodilation in young adults with metabolic syndrome.Am J Physiol Heart Circ Physiol. 2014 Jan 15;306(2):H261-9. doi: 10.1152/ajpheart.00709.2013. Epub 2013 Nov 8. Am J Physiol Heart Circ Physiol. 2014. PMID: 24213610 Free PMC article. Clinical Trial.
-
Co-administration of Ketamine in Pediatric Patients with Neurologic Conditions at Risk for Intracranial Hypertension.Neurocrit Care. 2023 Apr;38(2):242-253. doi: 10.1007/s12028-022-01611-2. Epub 2022 Oct 8. Neurocrit Care. 2023. PMID: 36207491 Free PMC article.
-
Differential contribution of cyclooxygenase to basal cerebral blood flow and hypoxic cerebral vasodilation.Am J Physiol Regul Integr Comp Physiol. 2020 Feb 1;318(2):R468-R479. doi: 10.1152/ajpregu.00132.2019. Epub 2019 Dec 23. Am J Physiol Regul Integr Comp Physiol. 2020. PMID: 31868517 Free PMC article.
-
Comparing end-tidal CO2, respiration volume per time (RVT), and average gray matter signal for mapping cerebrovascular reactivity amplitude and delay with breath-hold task BOLD fMRI.Neuroimage. 2023 May 15;272:120038. doi: 10.1016/j.neuroimage.2023.120038. Epub 2023 Mar 22. Neuroimage. 2023. PMID: 36958618 Free PMC article.
-
Continuous noninvasive blood gas estimation in critically ill pediatric patients with respiratory failure.Sci Rep. 2022 Jun 14;12(1):9853. doi: 10.1038/s41598-022-13583-6. Sci Rep. 2022. PMID: 35701446 Free PMC article.
References
-
- American Heart Association 2005 American Heart Association (AHA) guidelines for cardiopulmonary resuscitation (CPR) and emergency cardiovascular care (ECC) of pediatric and neonatal patients: pediatric advanced life support. Pediatrics. 2006;117(5):e1005–e1028. - PubMed
-
- Birmingham PK, Cheney FW, Ward RJ. Esophageal intubation: a review of detection techniques. Anesth Analg. 1986;65(8):886–891. - PubMed
-
- Knapp S, Kofler J, Stoiser B, Thalhammer F, Burgmann H, Posch M, et al. The assessment of four different methods to verify tracheal tube placement in the critical care setting. Anesth Analg. 1999;88(4):766–770. - PubMed
-
- Roberts WA, Maniscalco WM, Cohen AR, Litman RS, Chhibber A. The use of capnography for recognition of esophageal intubation in the neonatal intensive care unit. Pediatr Pulmonol. 1995;19(5):262–268. - PubMed
-
- Kannan S, Manji M. Survey of use of end-tidal carbon dioxide for confirming tracheal tube placement in intensive care units in the UK. Anaesthesia. 2003;58(5):476–479. - PubMed
MeSH terms
Substances
Grants and funding
LinkOut - more resources
Full Text Sources
Other Literature Sources
Medical