. 2010 Mar 3;98(5):784-92.
doi: 10.1016/j.bpj.2009.11.009.

An iris-like mechanism of pore dilation in the CorA magnesium transport system

Affiliations

An iris-like mechanism of pore dilation in the CorA magnesium transport system

Nilmadhab Chakrabarti et al. Biophys J. .

Abstract

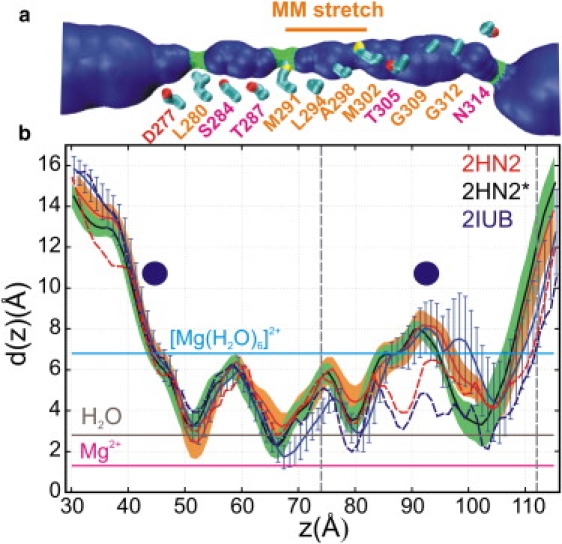
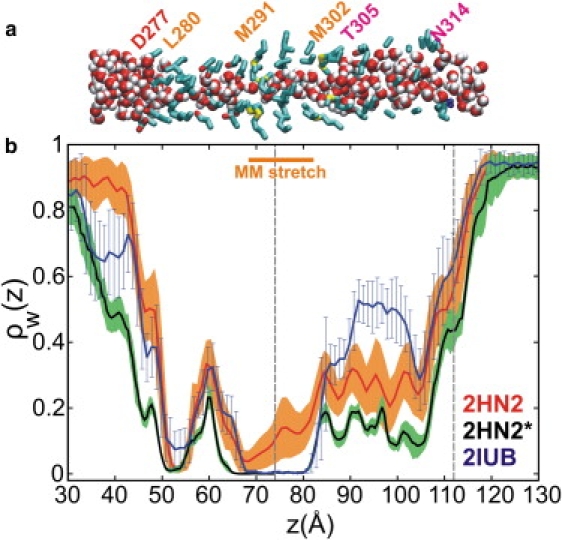
Magnesium translocation across cell membranes is essential for numerous physiological processes. Three recently reported crystal structures of the CorA magnesium transport system revealed a surprising architecture, with a bundle of giant alpha-helices forming a 60-A-long pore that extends beyond the membrane before widening into a funnel-shaped cytosolic domain. The presence of divalent cations in putative intracellular regulation sites suggests that these structures correspond to the closed conformation of CorA. To examine the nature of the conduction pathway, we performed 110-ns molecular-dynamics simulations of two of these structures in a lipid bilayer with and without regulatory ions. The results show that a 15-A-long hydrophobic constriction straddling the membrane-cytosol interface constitutes a steric bottleneck whose location coincides with an electrostatic barrier opposing cation translocation. In one of the simulations, structural relaxation after the removal of regulatory ions led to concerted changes in the tilt of the pore helices, resulting in iris-like dilation and spontaneous hydration of the hydrophobic neck. This simple and robust mechanism is consistent with the regulation of pore opening by intracellular magnesium concentration, and explains the unusual architecture of CorA.


Figures

Figure 1
Figure 1
Structural features of the TmCorA protein. (a) The Cα trace of two protomers of CorA are shown, with the pore-forming α7 helices (red), outer TM (α8) helices (green), EC loop (blue), and cytosolic part (orange) excluding the α7 helices i.e., the MBD. The MM stretch, the E316 residues at the EC mouth, the basic ring of lysine residues at the membrane-cytosol interface, and the only titratable pore-lining residue (D277) are also highlighted along with lumen-bound (blue near G309 and D277) and regulatory cations (green) as circles. (b) Top view of the pentamer from the EC side, colored by monomer.
Figure 2
Figure 2
Time evolution of the RMSDs of the Cα atoms of the stalk helices (light red) and the full protein (dark black) for the 2HN2 structure (a) without and (b) with regulatory ions, and (c) the 2IUB structure without ions. The EC loops, which are missing in the reference x-ray structures, are excluded from the analysis. (Color online).
Figure 3
Figure 3
Average pore diameter. (a) Rendering of lumen volume from the average MD structure from the 2HN2 model without regulatory ions, shown together with residues lining the pore. (b) Average pore diameters from MD simulations of 2HN2 without (solid red) and with (solid black) regulatory Mg2+ ions, and 2IUB simulations (solid blue). Pore diameters of the x-ray reference structures are included for 2HN2 (broken red) and 2IUB (broken blue). Also shown are the diameters of a hydrated magnesium ion, a water molecule, and a bare Mg ion. Two dashed vertical lines denote the membrane-water interface with cytoplasm and periplasm. The two disks indicate the location of crystallographic metal binding sites inside the lumen.
Figure 4
Figure 4
Axial distribution of water molecules in the channel lumen. (a) Representative snapshot from the end of the 2HN2 simulation without regulatory Mg2+ ions. (b) Average distribution of lumen water molecules along the channel axis from MD simulations of 2IUB (blue) and 2HN2 without (red) and with (black) regulatory Mg2+ ions. The average density was normalized with respect to the bulk water density.
Figure 5
Figure 5
Global structural changes and opening of the channel bottleneck in the 2HN2 system without regulatory ions. (a) NwMM¯, water count of the MM stretch of the pore (thin orange) and its running average (thick red). (b) Average distance of the axis of five α7 helices (MM stretch) from the center of the pore, dcenterMM¯. (c) Lateral tilt (θLatMM¯) of the five α7 helices in the MM stretch only. (d) Radial tilt (θRadIC¯) of the five α7 helices in the IC domain (below the G274 kink). (e) Distance between the centers of mass of neighboring IC MBDs (dMBD¯). In panels ce, data for five protomers and their average are shown in multicolor and thick red, respectively. (Color online).
Figure 6
Figure 6
Molecular mechanism of pore dilation. (a) Correlation of θRadIC¯ with dMBD¯, (b) correlation of θRadIC¯ with θLatMM¯, (c) correlation of dcenterMM¯ with θLatMM¯, and (d) correlation of dcenterMM¯ with NwMM¯. In all four panels, the green circles and red squares denote the results from the first 10 ns and 10–110 ns of the MD simulation trajectory, respectively. The running average (blue line) traces the temporal sequence from the initial (I) to the final (F) conformation. Symbols are defined in the caption of Fig. 5. The Pearson correlation coefficients (which range from −1 to 1) for 10–110 ns results are shown. The correlations for the full 0–110 ns trajectory are shown in brackets. (Color online).
Figure 7
Figure 7
Schematic representation of the iris-like mechanism of pore dilation. Side and top views are shown at the top and bottom for the closed state (left) and open state (right). For clarity, only one stalk helix is shown in the side view. A decrease of radial tilt θRadIC¯ in the conical IC domain (green) results in an increase in lateral tilt in the cylindrical MM stretch (red), leading to iris-like dilation of the pore. (Color online).
Figure 8
Figure 8
Average electrostatic energy profiles for permeation of a probe divalent cation. (a) The static field energy profiles for the wild-type channel (2HN2 structure) and its three hypothetical variants, with the charges of E316, basic ring (BR), and D277 sequentially turned off, are illustrated in solid red with orange shade, and green, blue, and black solid lines, respectively. Standard deviations in the static field profiles of hypothetical variants are very similar to that for wild-type and are omitted for clarity. (b) The average total electrostatic energy profiles for the 2HN2 system with (black) and without (red and green) regulatory ions. Comparatively wide (W; NwMM¯ > 9) and narrow (N; NwMM¯ ≤ 9) states, from the 2HN2 system without regulatory ions, are shown in green and red, with gray and orange shading, respectively. Two blue circles represent the two crystallographic divalent cation binding sites (near D277 and G309) in the lumen (6), and two dashed vertical lines denote the location of the membrane. Analogous results for the wild-type 2IUB model are shown in Fig. S7 and Fig. S8.

Similar articles

Cited by

References

    1. Touyz R.M. Magnesium and hypertension. Curr. Opin. Nephrol. Hypertens. 2006;15:141–144. - PubMed
    1. Maguire M.E., Cowan J.A. Mg2+ chemistry and biochemistry. Biometals. 2002;15:203–210. - PubMed
    1. Whelton P.K., Klag M.J. Magnesium and blood pressure: review of the epidemiologic and clinical trial experience. Am. J. Cardiol. 1989;63:26G–30G. - PubMed
    1. Lunin V.V., Dobrovetsky E., Koth C.M. Crystal structure of the CorA Mg2+ transporter. Nature. 2006;440:833–837. - PMC - PubMed
    1. Eshaghi S., Niegowski D., Nordlund P. Crystal structure of a divalent metal ion transporter CorA at 2.9 Ångstrom resolution. Science. 2006;313:354–357. - PubMed

Publication types

LinkOut - more resources