

Mouse fibroblast cell adhesion studied by neutron reflectometry
- PMID: 20197032
- PMCID: PMC2830441
- DOI: 10.1016/j.bpj.2009.11.019
Mouse fibroblast cell adhesion studied by neutron reflectometry
Abstract
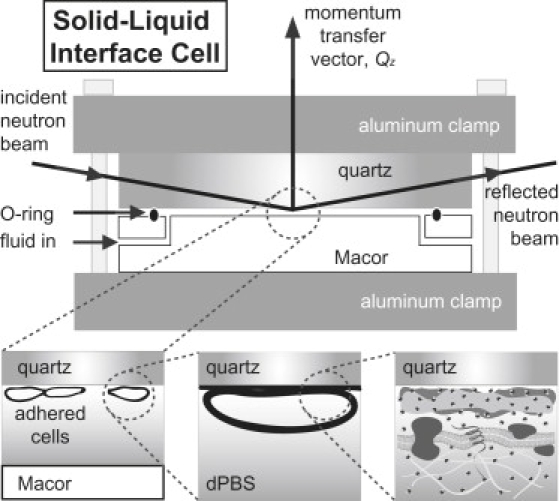
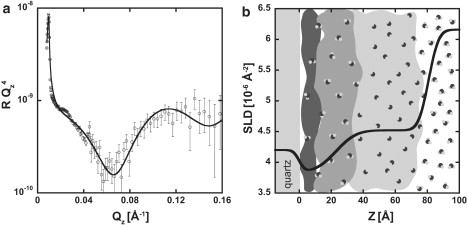
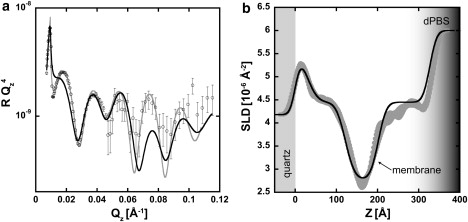
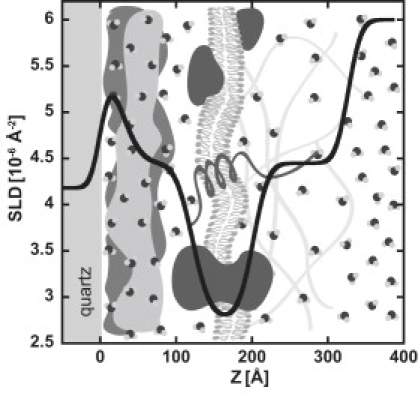
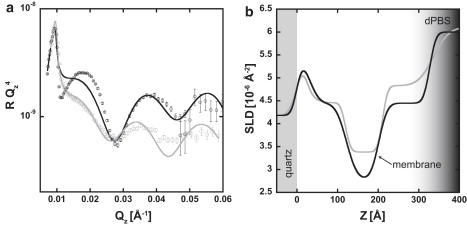
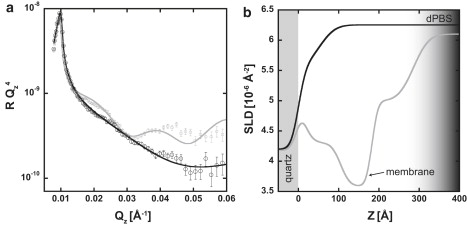
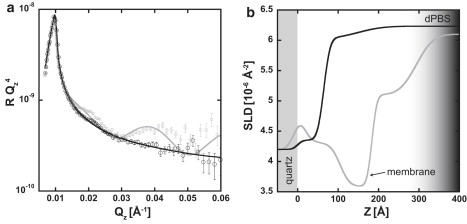
Neutron reflectometry (NR) was used to examine live mouse fibroblast cells adherent on a quartz substrate in a deuterated phosphate-buffered saline environment at room temperature. These measurements represent the first, to our knowledge, successful visualization and quantization of the interface between live cells and a substrate with subnanometer resolution using NR. NR data, attributable to the adhesion of live cells, were observed and compared with data from pure growth medium. Independently of surface cell density, the average distance between the center of the cell membrane region and the quartz substrate was determined to be approximately 180 A. The membrane region ( approximately 80 A thick) contains the membranes of cells that are inhomogeneously distributed or undulating, likely conforming to the nonplanar geometry of the supporting adherence proteins. A second region of cell membranes at a greater distance from the substrate was not detectable by NR due to the resolution limits of the technique employed. Attachment of the live cell samples was confirmed by interaction with both distilled water and trypsin. Distinct changes in the NR data after exposure indicate the removal of cells from the substrate.
2010 Biophysical Society. Published by Elsevier Inc. All rights reserved.
Figures
Similar articles
-
Understanding dynamic changes in live cell adhesion with neutron reflectometry.Mod Phys Lett B. 2014 Dec 10;28(30):1430015. doi: 10.1142/S0217984914300154. Mod Phys Lett B. 2014. PMID: 25705067 Free PMC article.
-
Investigations of surrogate cellular membranes using neutron reflectometry.Acta Crystallogr D Biol Crystallogr. 2010 Nov;66(Pt 11):1237-43. doi: 10.1107/S090744491001766X. Epub 2010 Oct 20. Acta Crystallogr D Biol Crystallogr. 2010. PMID: 21041944
-
Surface enrichment of proteins at quartz/water interfaces: a neutron reflectivity study.J Colloid Interface Sci. 2005 May 15;285(2):458-68. doi: 10.1016/j.jcis.2004.11.060. J Colloid Interface Sci. 2005. PMID: 15837460
-
Studying the surfaces of bacteria using neutron scattering: finding new openings for antibiotics.Biochem Soc Trans. 2020 Oct 30;48(5):2139-2149. doi: 10.1042/BST20200320. Biochem Soc Trans. 2020. PMID: 33005925 Free PMC article. Review.
-
Structural Investigations of Protein-Lipid Complexes Using Neutron Scattering.Methods Mol Biol. 2019;2003:201-251. doi: 10.1007/978-1-4939-9512-7_11. Methods Mol Biol. 2019. PMID: 31218621 Review.
Cited by
-
Understanding dynamic changes in live cell adhesion with neutron reflectometry.Mod Phys Lett B. 2014 Dec 10;28(30):1430015. doi: 10.1142/S0217984914300154. Mod Phys Lett B. 2014. PMID: 25705067 Free PMC article.
-
Tuning endothelial monolayer adhesion: a neutron reflectivity study.Am J Physiol Lung Cell Mol Physiol. 2014 Jan 1;306(1):L1-9. doi: 10.1152/ajplung.00160.2013. Epub 2013 Oct 25. Am J Physiol Lung Cell Mol Physiol. 2014. PMID: 24163142 Free PMC article.
-
Neural Stem Cell Spreading on Lipid Based Artificial Cell Surfaces, Characterized by Combined X-ray and Neutron Reflectometry.Materials (Basel). 2010 Nov 22;3(11):4994-5006. doi: 10.3390/ma3114994. Materials (Basel). 2010. PMID: 28883366 Free PMC article.
-
Study of cell-matrix adhesion dynamics using surface plasmon resonance imaging ellipsometry.Biophys J. 2011 Apr 6;100(7):1819-28. doi: 10.1016/j.bpj.2011.01.033. Biophys J. 2011. PMID: 21463596 Free PMC article.
References
-
- Verschueren H. Interference reflection microscopy in cell biology: methodology and applications. J. Cell Sci. 1985;75:279–301. - PubMed
-
- Izzard C.S., Lochner L.R. Cell-to-substrate contacts in living fibroblasts: an interference reflexion study with an evaluation of the technique. J. Cell Sci. 1976;21:129–159. - PubMed
Publication types
MeSH terms
Substances
Grants and funding
LinkOut - more resources
Full Text Sources
