. 2010 May;44(1):94-108.
doi: 10.1016/j.mcn.2010.01.012. Epub 2010 Mar 1.

MEF-2 regulates activity-dependent spine loss in striatopallidal medium spiny neurons

Affiliations

MEF-2 regulates activity-dependent spine loss in striatopallidal medium spiny neurons

Xinyong Tian et al. Mol Cell Neurosci. 2010 May.

Abstract

Striatal dopamine depletion profoundly reduces the density of spines and corticostriatal glutamatergic synapses formed on D(2) dopamine receptor expressing striatopallidal medium spiny neurons, leaving D(1) receptor expressing striatonigral medium spiny neurons relatively intact. Because D(2) dopamine receptors diminish the excitability of striatopallidal MSNs, the pruning of synapses could be a form of homeostatic plasticity aimed at restoring activity into a preferred range. To characterize the homeostatic mechanisms controlling synapse density in striatal medium spiny neurons, striatum from transgenic mice expressing a D(2) receptor reporter construct was co-cultured with wild-type cerebral cortex. Sustained depolarization of these co-cultures induced a profound pruning of glutamatergic synapses and spines in striatopallidal medium spiny neurons. This pruning was dependent upon Ca(2+) entry through Cav1.2 L-type Ca(2+) channels, activation of the Ca(2+)-dependent protein phosphatase calcineurin and up-regulation of myocyte enhancer factor 2 (MEF2) transcriptional activity. Depolarization and MEF2 up-regulation increased the expression of two genes linked to synaptic remodeling-Nur77 and Arc. Taken together, these studies establish a translational framework within which striatal adaptations linked to the symptoms of Parkinson's disease can be explored.


Figures

Fig. 1
Fig. 1
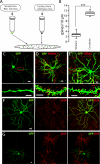
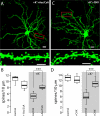
Medium spiny neurons in cortical co-cultures have mature dendritic architecture and synaptic connectivity. (A) Scheme of the preparation of corticostriatal co-culture. (B) Quantification of the spine density of EGFP labeled neurons in pure striatal cultures and corticostriatal co-cultures. Spine density was significantly high in co-cultures (Striatum, median=2.8, n=14; Co-culture, median=11.0, n=14; ***p<0.001, Mann-Whitney Rank Sum test). (C) A EGFP-labeled neuron in a pure striatal culture. (D) to (G), Images of EGFP-labeled neurons in corticostriatal co-cultures stained with antibodies against PSD95, vGlut1, D2R or D1R. Scale bar: low magnification images, 10 μm; high magnification images 5 μm.
Fig. 2
Fig. 2
Membrane depolarization induces Ca2+ influx and spine loss. (A) Membrane depolarization of D2 MSNs in response to elevated extracellular potassium concentration (mM, n=5 for each concentration). The membrane potentials measured correlate to those predicted by Nernst equation. (B-E) Membrane depolarization induces L-type Ca2+ channel-dependent Ca2+ elevation in D2 MSNs. Images of Fura-2 AM loaded D2 MSNs in Corticostriatal co-culture were captured using two-photon microscopy. Images of two EGFP-labeled cells stimulated with 35 mM KCl in presence of ionotropic receptor blockers are shown at excitation wavelength 950 nm (B), and 700 nm (C) and 780 nm (D). Scale bar, 10 μm. Ca2+ concentration in the somas of D2 MSNs was determined by computing the ratio 700/780 images. (E) Changes of Ca2+ concentration relative to baselines are shown as a function of time for D2 MSNs stimulated by membrane depolarization (n=4, black traces) or D2 MSNs stimulated in the presence of 10 μM nimodipine (n=6, red traces). (F) A D2 MSN in corticostriatal co-cultures treated with 35 mM KCl for 24 hours in presence of ionotropic receptor blockers at 20 DIV. Bar: upper panel 10 μm; lower panel, 5 μm. (G) Time course of the change of spine density in D2 MSNs after membrane depolarization. Spine density is shown in mean±standard deviation (p<0.001, one way ANOVA; Ctrl, 11.69±1.66, n=12; 8 hrs, 10.41±1.13, n=16; 16 hrs, 8.42±1.99, n=14; 24 hrs, 5.79±0.96, n=14). (H) Spine losses in D2 and D1 MSNs after 24 hours of membrane depolarization. (35 mM KCl treated groups are shown in shadows. D2 MSNs control, median=11.3, n=21; D2 MSNs with 35 mM KCl, median=5.3, n=23; D1 MSNs, median=10.8, n=21; D1 MSNs with 35 mM KCl, median=9.5, n=24. *p<0.05, ***p<0.001, Mann-Whitney Rank Sum Test)
Fig. 3
Fig. 3
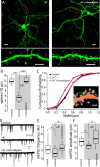
L-type Ca2+ channels are necessary for spine and synapse elimination. (A) Images of D2 MSNs in corticostriatal co-cultures treated with 35 mM KCl and ionotropic receptor blockers for 24 hours, in absence or presence of 10 μM nimodipine. Bar, upper panels 10 μm; lower panels, 5 μm. (B) Quantification of spine density showing that nimodipine blocked the membrane depolarization-induced spine loss (control, median=11.9, n=15; +K+, median=5.6, n=18; +K++nimodipine, median=11.9, n=13). (C) Cumulative frequency plot of spine head width showing that nimodipine blocked the reduction of spine size induced by membrane depolarization (control, median=0.5, n=412; +K+, median=0.40, n=410; +K++nimodipine, median=0.50, n=333; +K+ vs. control and +K+ vs. +K++nimodipine, p<0.001, Mann-Whitney Rank Sum Test). Insert showing method of measuring the spine head width in Metamorph software. Scale bar, 2μm. (D) Examples of mEPSCs recording from the D2 MSNs treated as in (A). (E) Box plot showing membrane depolarization resulted in reduction of mEPSC frequency (control, median=2.17, n=19; +K+, median=1.29, n=14), which was blocked by nimodipine (+K++nimodipine, median=2.92, n=18). (F) Box plot showing membrane depolarization resulted in reduction of mEPSC amplitude (control, median=15.74, n=19; +K+, median=11.89, n=14), which was blocked by nimodipine, (+K++nimodipine, median=18.15, n=18). *p<0.05, ***p<0.001, Mann-Whitney Rank Sum Test.
Fig. 4
Fig. 4
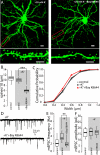
Enhanced L-type Ca2+ channel opening increases the effects of membrane depolarization. (A) Images of D2 MSNs in corticostriatal co-cultures treated with 20 mM KCl and ionotropic receptor blockers for 24 hours, in the absence or presence of 1 μM Bay K8644. Bar: upper panels 10 μm; lower panels, 5 μm. (B) Quantification of spine density showing that Bay K8644 treatment decreased spine density in the D2 MSNs depolarized by 20 mM KCl (+K+, median =10.1 n=15; +K++Bay K8644, median=5.9, n=14). (C) Quantification of spine head width showing Bay K8644 treatment decreased the spine size in the D2 MSNs depolarized by 20 mM KCl (+K+, median =0.50, n=336; +K++Bay K8644, median=0.45, n=335; p<0.001, Mann-Whitney Rank Sum Test). (D) Examples of mEPSCs recording from the D2 MSNs treated as in (A). (E) Box plot showing that Bay K8644 treatment reduced mEPSC frequency in D2 MSNs depolarized by 20 mM KCl (+K+, median =3.46, n=16; +K++Bay K8644, median=1.82, n=12). (F) Box plot showing that Bay K8644 treatment had no significant effect on mEPSC amplitude (+K+, median =17.09, n=16; +K++Bay K8644, median=16.82, n=12; p=0.981 Mann-Whitney Rank Sum Test). **p<0.005, ***p<0.001, Mann-Whitney Rank Sum Test.
Fig. 5
Fig. 5
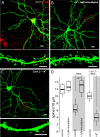
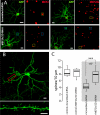
Cav1.2 but not Cav1.3 L-type Ca2+ channels are required for membrane depolarization-induced spine loss. (A) Expression of Cav1.2 L-type Ca2+ channel in a D2 MSN. Lower panel shows dendritic expression of Cav1.2 L-type Ca2+ channel. (B) A D2 MSN in a corticostriatal co-culture treated with 35 mM KCl and ionotropic receptor blockers for 24 hours in the present of 1 μM nimodipine. (C) A Cav1.3 deficient D2 MSN in corticostriatal co-culture treated with 35 mM KCl and ionotropic receptor blockers. (D) Quantification of spine density shows that 1 μM Nimodipine treatment blocks the membrane depolarization-induced spine loss (+K+, median=6.2, n=15; +K++1μm nimodipine, median=13.2, n=15), and membrane depolarization induces spine loss in D2 MSNs deficient of Cav1.3 Ca2+ channels (control, median=10.0, n=14; +K+, median=3.9, n=17). ***p<0.001, Mann-Whitney Rank Sum Test. Scale bar: low magnification images, 10 μm; high magnification images 5 μm.
Fig. 6
Fig. 6
Calcineurin and protein synthesis are necessary for spine pruning. (A) A D2 MSN in a corticostriatal co-culture treated with 35 mM KCl and ionotropic receptor blockers for 24 hours in the presence of calcineurin inhibitors ascomycin (1 μM) and cyclosporin (4 μM). (B) Quantification of spine density in D2 MSNs treated as indicated. Calcineurin inhibitors attenuated the membrane depolarization-induced spine loss (+K+, median=5.2, n=15; +K++Asc/CsA, median=7.9, n=15). (C) A D2 MSN in a corticostriatal co-culture treated with 35 mM KCl and ionotropic receptor blockers for 24 hours in the presence of protein synthesis inhibitor cycloheximide (10 μM). (D) Quantification of spine density in D2 MSNs treated as indicated. Cycloheximide attenuated the membrane depolarization-induced spine loss (+K+, median=5.8, n=16; +K++CHX, median=10.8, n=15) ***p<0.001, Mann-Whitney Rank Sum Test. Scale bar: low magnification images, 10 μm; high magnification images 5 μm.
Fig. 7
Fig. 7
MEF2 activity is necessary for membrane depolarization-induced spine loss in D2 MSNs. (A) D2 MSNs transfected with indicated shRNA expressing constructs at 15DIV and stained with generic anti-MEF2 antibody or anti-MEF2D antibody 48 hours later. Transfected D2 MSNs are shown in yellow squares, while untransfected ones are shown in blue squares. Scale bar, 20 μm. (B) A D2 MSN in corticostriatal co-culture transfected with MEF2 shRNA and treated with 35 mM KCl and ionotropic receptor blockers for 24 hours. Scale bar: low magnification images, 10 μm; high magnification images 5 μm. (C) Quantification of spine density in D2 MSNs treated as indicated. Knockdown of MEF2 blocks membrane depolarization-induced spine loss in D2 MSNs (+K++Scrambled shRNA, median=4.2, n=15; +K++MEF2A/2D shRNA, median=7.9, n=15). *** p<0.001, Mann-Whitney Rank Sum Test.
Fig. 8
Fig. 8
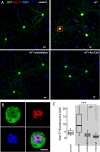
L-type Ca2+ channel- and calcineurin-dependent induction of Nur77 expression in D2 MSNs in response to membrane depolarization. (A) Images of D2 MSNs treated with 35 mM KCl and ionotropic receptor blockers for 24 hrs in absence or presence of nimodipine or Ascomycin/Cyclosporin A. Cultures were stained with anti-GFP antibody (Green), anti-Nur77 antibody (red) and 4 ,6 -diamidino-phenylindole (DAPI, blue). (B) A representative image at a focal plane (1 micron thick) through the soma of a depolarized cell marked in (A) showing that most of Nur77 staining is localized in nucleus. (C) Quantitative analysis of Nur77 staining in the nuclei of D2 MSNs showing that KCl treatment increases intensity of Nur77 staining (control, median=4318, n=99; +K+, median=9206.5, n=198), and nimodipine or Asc/CsA blocks the depolarization-induced Nur77 increase (+K++nimodipine, median=3014.5, n=198; +K++Asc/CsA, median=1876.5, n=104). *** p<0.001, Mann-Whitney Rank Sum Test. Scale bar: low magnification images, 10 μm; high magnification images 5 μm.
Fig. 9
Fig. 9
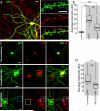
Membrane depolarization induces MEF2-dependent Arc expression. (A) A D2 MSN in a corticostriatal co-culture treated with 35 mM KCl and ionotropic receptor blockers for 2 hours and stained with anti-GFP and anti-Arc antibodies. High magnification images (right panels) show Arc expression in dendrites. (B) Quantification of average fluorescence intensity of Arc immunostaining in the soma area of D2 MSNs depolarized for 2 hours and 6 hours. (control median=2.47, n=33; 2 hours with K+, median=27.28, n=21; 6 hours with K+, median=11.4, n=25). (C) Upper panel shows the image of a D2 MSNs in non-transfected culture. Middle and lower panels show the images of D2 MSNs in corticostriatal co-cultures transfected with indicated shRNAs and depolarized for 2 hours. Transfected cells are shown in yellow squares, an untransfected cells is shown in a blue square. Note that different microscope setups were used for experiments in (A) and (C). (D) Quantification showing MEF2 RNAi significantly reduces membrane depolarization-induced Arc expression (scrambled shRNA, median=23.13, n=13; MEF2A/2D RNAi, median=15.13, n=15). **p<0.005, *** p<0.001. Mann-Whitney Rank Sum Test. Scale bar: low magnification images, 10 μm; high magnification images 5 μm.

Similar articles

Cited by

References

    1. Adermark L, Lovinger DM. Combined activation of L-type Ca2+ channels and synaptic transmission is sufficient to induce striatal long-term depression. J Neurosci. 2007;27:6781–6787. - PMC - PubMed
    1. Albin RL, Young AB, Penney JB. The functional anatomy of basal ganglia disorders. Trends in neurosciences. 1989;12:366–375. - PubMed
    1. Bevan MD, Magill PJ, Terman D, Bolam JP, Wilson CJ. Move to the rhythm: oscillations in the subthalamic nucleus-external globus pallidus network. Trends in neurosciences. 2002;25:525–531. - PubMed
    1. Blackstone C, Sheng M. Protein targeting and calcium signaling microdomains in neuronal cells. Cell Calcium. 1999;26:181–192. - PubMed
    1. Bolam JP, Hanley JJ, Booth PAC, Bevan MD. Synaptic organisation of the basal ganglia. Journal of Anatomy. 2000;196:527–542. - PMC - PubMed

Publication types

MeSH terms