

An innovative method to classify SERMs based on the dynamics of estrogen receptor transcriptional activity in living animals
- PMID: 20197311
- PMCID: PMC2852355
- DOI: 10.1210/me.2009-0514
An innovative method to classify SERMs based on the dynamics of estrogen receptor transcriptional activity in living animals
Abstract
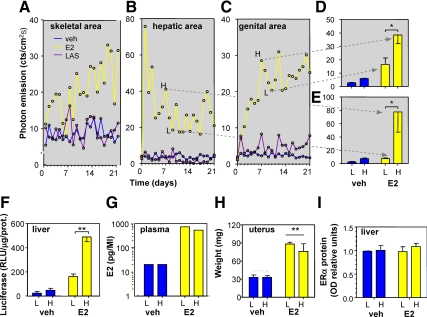
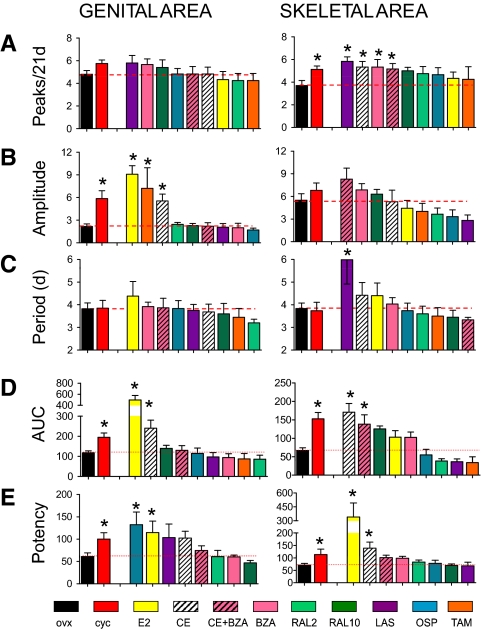
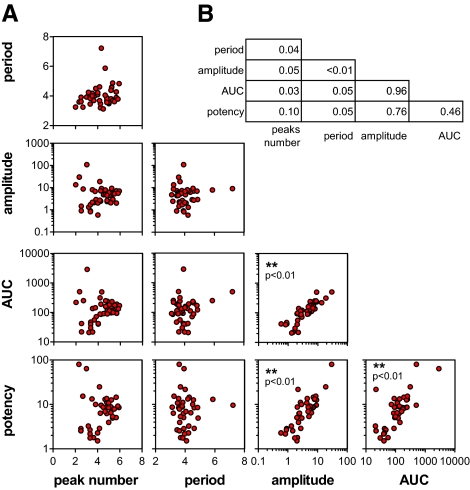
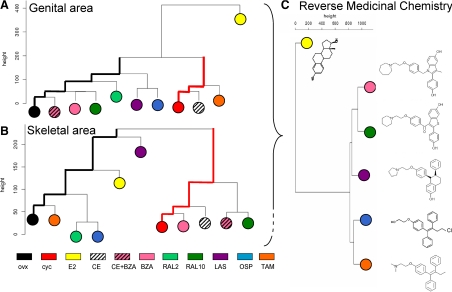
Using a mouse model engineered to measure estrogen receptor (ER) transcriptional activity in living organisms, we investigated the effect of long-term (21 d) hormone replacement on ER signaling by whole-body in vivo imaging. Estrogens and selective ER modulators were administered daily at doses equivalent to those used in humans as calculated by the allometric approach. As controls, ER activity was measured also in cycling and ovariectomized mice. The study demonstrated that ER-dependent transcriptional activity oscillated in time, and the frequency and amplitude of the transcription pulses was strictly associated with the target tissue and the estrogenic compound administered. Our results indicate that the spatiotemporal activity of selective ER modulators is predictive of their structure, demonstrating that the analysis of the effect of estrogenic compounds on a single surrogate marker of ER transcriptional activity is sufficient to classify families of compounds structurally and functionally related. For more than one century, the measure of drug structure-activity relationships has been based on mathematical equations describing the interaction of the drug with its biological receptor. The understanding of the multiplicity of biological responses induced by the drug-receptor interaction demonstrated the limits of current approach and the necessity to develop novel concepts for the quantitative analysis of drug action. Here, a systematic study of spatiotemporal effects is proposed as a measure of drug efficacy for the classification of pharmacologically active compounds. The application of this methodology is expected to simplify the identification of families of molecules functionally correlated and to speed up the process of drug discovery.
Figures
Similar articles
-
Effects of various selective estrogen receptor modulators with or without conjugated estrogens on mouse mammary gland.Endocrinology. 2009 Apr;150(4):1897-903. doi: 10.1210/en.2008-1210. Epub 2008 Nov 20. Endocrinology. 2009. PMID: 19022889
-
Selective estrogen receptor modulators and the combination therapy conjugated estrogens/bazedoxifene: A review of effects on the breast.Post Reprod Health. 2015 Sep;21(3):112-21. doi: 10.1177/2053369115599090. Epub 2015 Aug 19. Post Reprod Health. 2015. PMID: 26289836 Review.
-
Differential effects of selective estrogen receptor modulators and estrogens on mammary blood flow in the ovine.Am J Obstet Gynecol. 2002 Dec;187(6):1555-60. doi: 10.1067/mob.2002.127600. Am J Obstet Gynecol. 2002. PMID: 12501063
-
Effect of chronic estradiol, tamoxifen or raloxifene treatment on serotonin 5-HT1A receptor.Brain Res Mol Brain Res. 2003 Apr 10;112(1-2):82-9. doi: 10.1016/s0169-328x(03)00049-4. Brain Res Mol Brain Res. 2003. PMID: 12670705
-
Selective estrogen receptor modulators: mechanism of action and clinical experience. Focus on raloxifene.Reprod Fertil Dev. 2001;13(4):331-6. doi: 10.1071/rd00109. Reprod Fertil Dev. 2001. PMID: 11800172 Review.
Cited by
-
Sexually immature male ERE-Luc reporter mice to assess low dose estrogen-like effects of CdCl2 versus dietary Cd.Am J Nucl Med Mol Imaging. 2014 Apr 25;4(3):270-82. eCollection 2014. Am J Nucl Med Mol Imaging. 2014. PMID: 24795841 Free PMC article.
-
Liganded and unliganded activation of estrogen receptor and hormone replacement therapies.Biochim Biophys Acta. 2011 Aug;1812(8):1054-60. doi: 10.1016/j.bbadis.2011.05.001. Epub 2011 May 14. Biochim Biophys Acta. 2011. PMID: 21605666 Free PMC article. Review.
-
Development of a novel molecular sensor for imaging estrogen receptor-coactivator protein-protein interactions.PLoS One. 2012;7(8):e44160. doi: 10.1371/journal.pone.0044160. Epub 2012 Aug 28. PLoS One. 2012. PMID: 22952913 Free PMC article.
-
Energy metabolism and fertility: a balance preserved for female health.Nat Rev Endocrinol. 2014 Jan;10(1):13-23. doi: 10.1038/nrendo.2013.203. Epub 2013 Oct 22. Nat Rev Endocrinol. 2014. PMID: 24146033 Review.
-
The conundrum of estrogen receptor oscillatory activity in the search for an appropriate hormone replacement therapy.Endocrinology. 2011 Jun;152(6):2256-65. doi: 10.1210/en.2011-0173. Epub 2011 Apr 19. Endocrinology. 2011. PMID: 21505049 Free PMC article.
References
-
- Dahlman-Wright K, Cavailles V, Fuqua SA, Jordan VC, Katzenellenbogen JA, Korach KS, Maggi A, Muramatsu M, Parker MG, Gustafsson JA 2006 International Union of Pharmacology. LXIV. Estrogen receptors. Pharmacol Rev 58:773–781 - PubMed
-
- Bolego C, Vegeto E, Pinna C, Maggi A, Cignarella A Selective agonists of estrogen receptor isoforms: new perspectives for cardiovascular disease. 2006 Arterioscler Thromb Vasc Biol 26:2192–2199 - PubMed
-
- Imai Y, Kondoh S, Kouzmenko A, Kato S 2009 Regulation of bone metabolism by nuclear receptors. Mol Cell Endocrinol 310:3–10 - PubMed
-
- Cauley JA, Robbins J, Chen Z, Cummings SR, Jackson RD, LaCroix AZ, LeBoff M, Lewis CE, McGowan J, Neuner J, Pettinger M, Stefanick ML, Wactawski-Wende J, Watts NB 2003 Effects of estrogen plus progestin on risk of fracture and bone mineral density: the Women’s Health Initiative randomized trial. JAMA 290:1729–1738 - PubMed
-
- Straub RH The complex role of estrogens in inflammation. 2007 Endocr Rev 28:521–574 - PubMed
