

Regulation of fibroblast growth factor-2 by an endogenous antisense RNA and by argonaute-2
- PMID: 20197313
- PMCID: PMC5417538
- DOI: 10.1210/me.2009-0367
Regulation of fibroblast growth factor-2 by an endogenous antisense RNA and by argonaute-2
Abstract
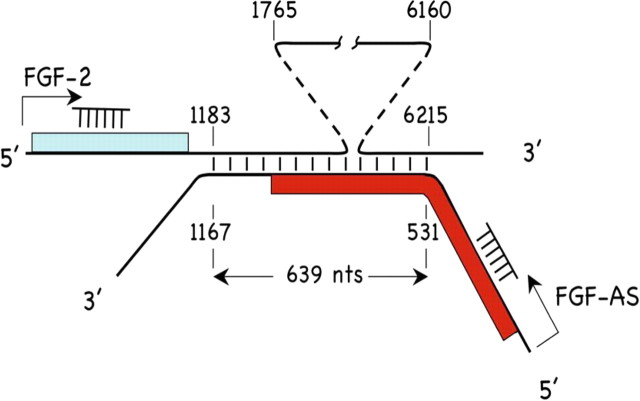
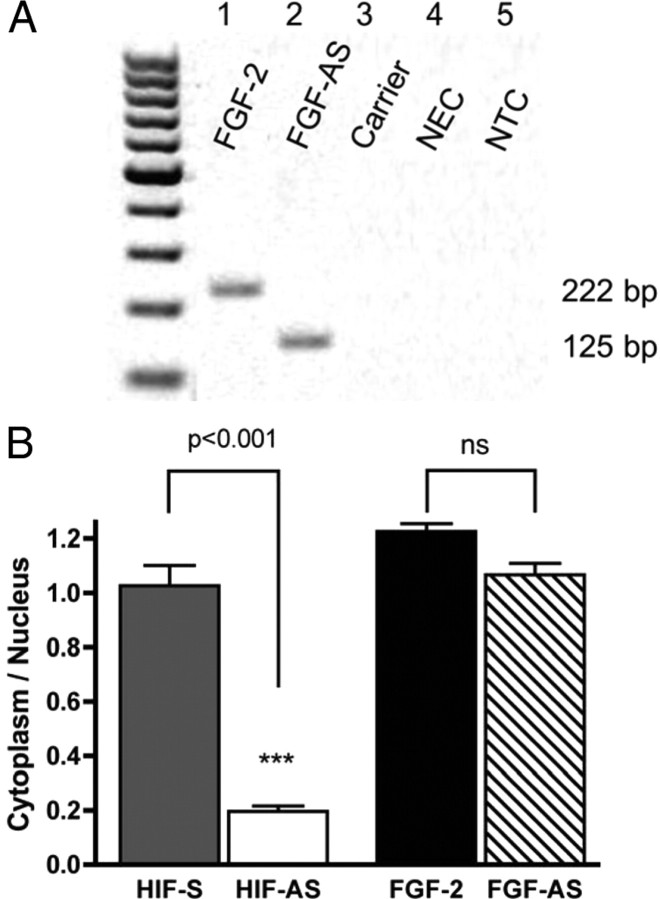
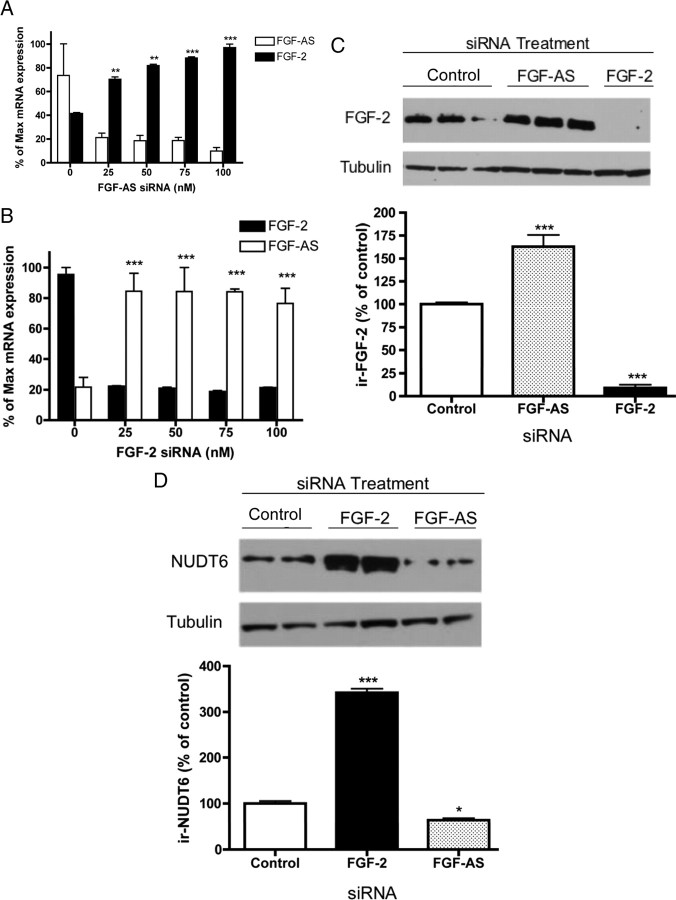
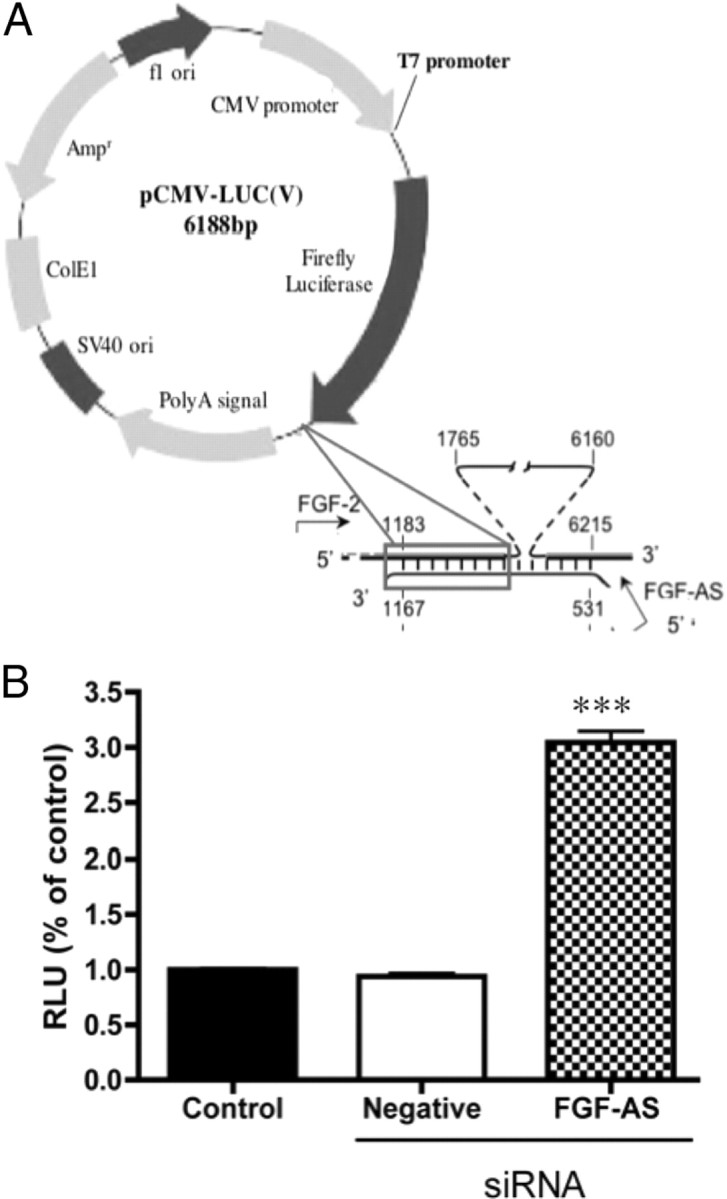
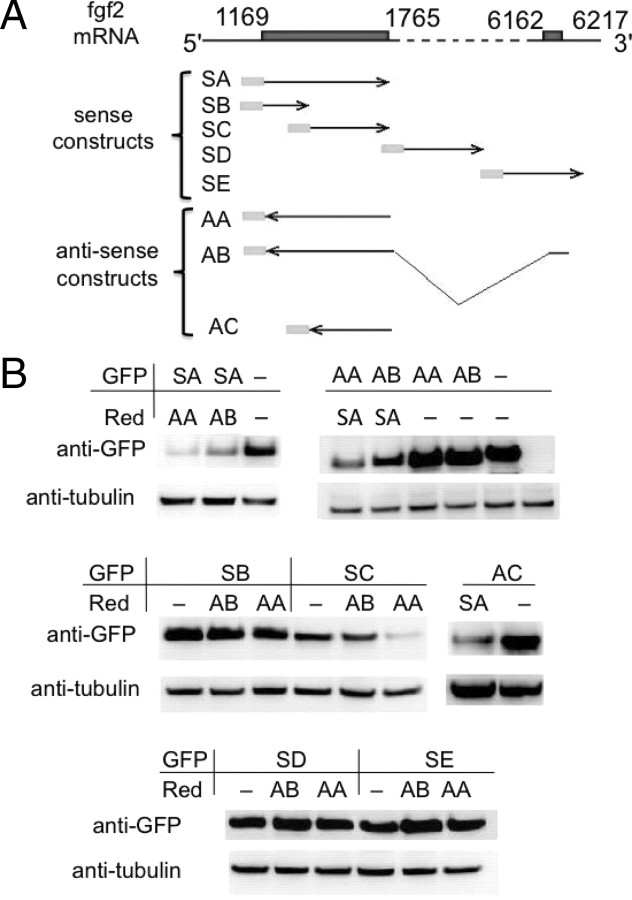
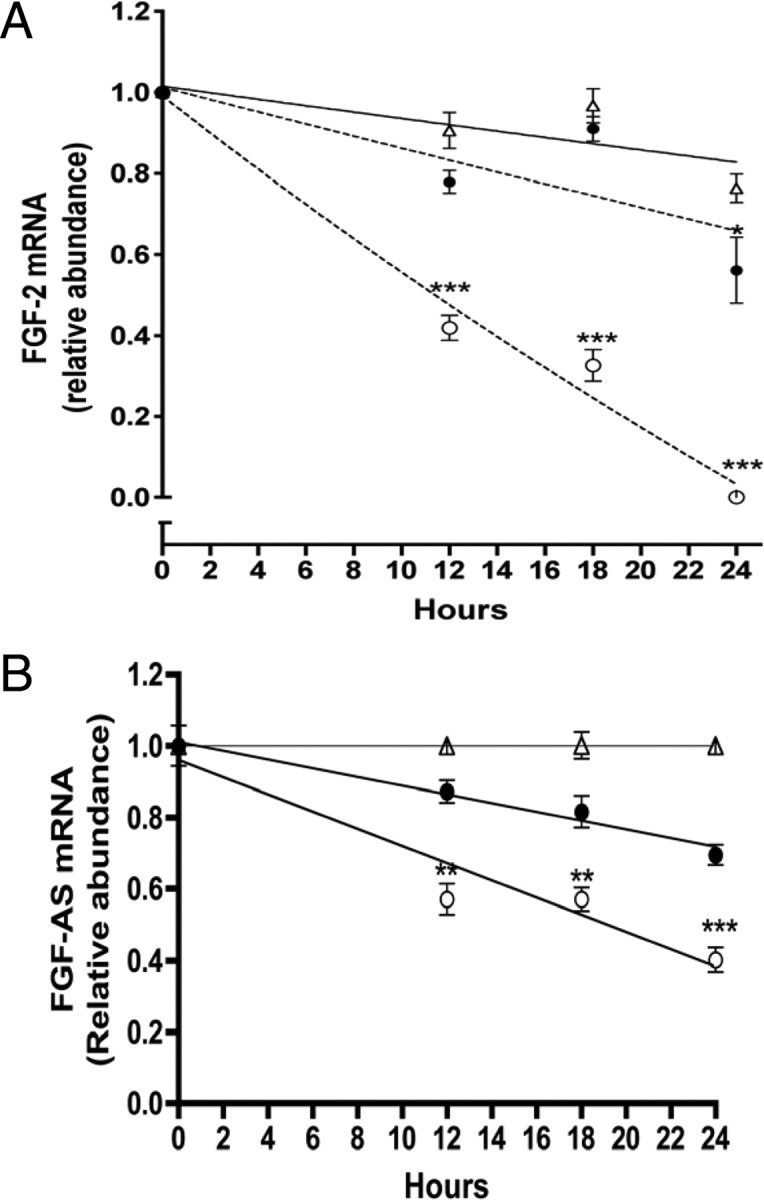
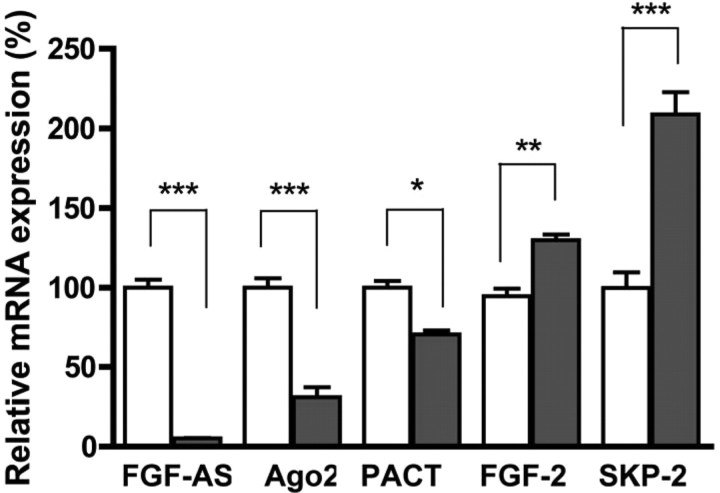
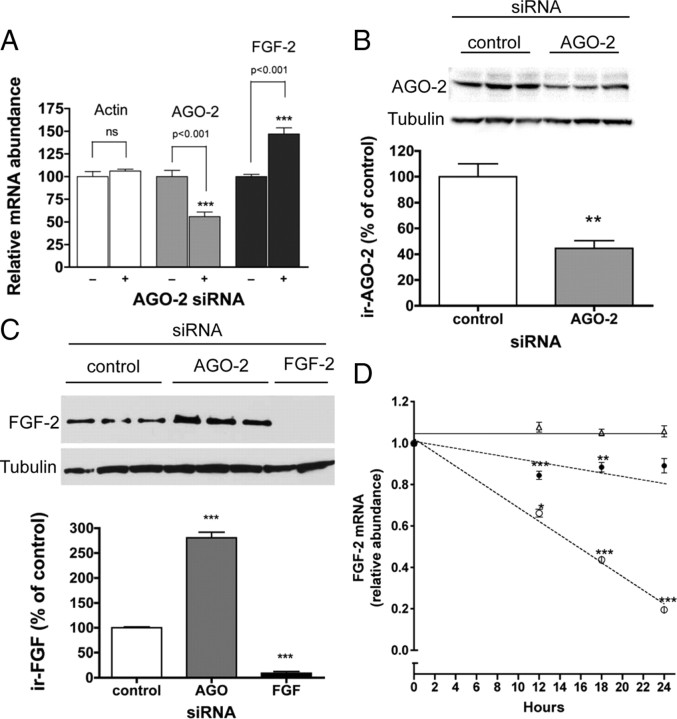
We have previously reported that elevated fibroblast growth factor-2 (FGF-2) expression is associated with tumor recurrence and reduced survival after surgical resection of esophageal cancer and that these risks are reduced in tumors coexpressing an endogenous antisense (FGF-AS) RNA. In the present study, we examined the role of the endogenous FGF-AS transcript in the regulation of FGF-2 expression in the human lung adenocarcinoma cell line Seg-1. FGF-2 and FGF-AS were temporally and spatially colocalized in the cytoplasm of individual cells, and knockdown of either FGF-2 or FGF-AS by target-specific siRNAs resulted in dose-dependent up-regulation of the complementary transcript and its encoded protein product. Using a luciferase reporter system, we show that these effects are mediated by interaction of the endogenous antisense RNA with the 3'-untranslated region of the FGF-2 mRNA. Deletion mapping identified a 392-nucleotide sequence in the 5823-nucleotide FGF-2 untranslated tail that is targeted by FGF-AS. Small interfering RNA-mediated knockdown of either FGF-AS or FGF-2 significantly increased the stability of the complementary partner mRNA, demonstrating that these mRNAs are mutually regulatory. Knockdown of FGF-AS also resulted in reduced expression of argonaute-2 (AGO-2) and a number of other elements of the endogenous micro-RNA/RNA interference pathways. Conversely, small interfering RNA-mediated knockdown of AGO-2 significantly increased the stability of the FGF-2 mRNA transcript and the steady-state levels of both FGF-2 mRNA and protein, suggesting a role for AGO-2 in the regulation of FGF-2 expression.
Figures
Similar articles
-
Regulation of FGF-2 by an endogenous antisense RNA: effects on cell adhesion and cell-cycle progression.Mol Carcinog. 2010 Dec;49(12):1031-44. doi: 10.1002/mc.20686. Mol Carcinog. 2010. PMID: 20945415
-
Basic fibroblast growth factor (FGF-2) overexpression is a risk factor for esophageal cancer recurrence and reduced survival, which is ameliorated by coexpression of the FGF-2 antisense gene.Clin Cancer Res. 2005 Nov 1;11(21):7683-91. doi: 10.1158/1078-0432.CCR-05-0771. Clin Cancer Res. 2005. PMID: 16278388
-
Alternative splicing of the FGF antisense gene: differential subcellular localization in human tissues and esophageal adenocarcinoma.J Mol Med (Berl). 2007 Nov;85(11):1215-28. doi: 10.1007/s00109-007-0219-9. Epub 2007 Jun 14. J Mol Med (Berl). 2007. PMID: 17569023
-
Implications of polyadenylation in health and disease.Nucleus. 2014;5(6):508-19. doi: 10.4161/nucl.36360. Epub 2014 Oct 31. Nucleus. 2014. PMID: 25484187 Free PMC article. Review.
-
Antisense RNA: the new favorite in genetic research.J Zhejiang Univ Sci B. 2018 Oct.;19(10):739-749. doi: 10.1631/jzus.B1700594. J Zhejiang Univ Sci B. 2018. PMID: 30269442 Free PMC article. Review.
Cited by
-
The impact of variations in transcription of DICER and AGO2 on exacerbation of childhood B-cell lineage acute lymphoblastic leukaemia.Int J Exp Pathol. 2019 Jun;100(3):184-191. doi: 10.1111/iep.12316. Epub 2019 May 15. Int J Exp Pathol. 2019. PMID: 31090156 Free PMC article.
-
Argonaute Proteins Take Center Stage in Cancers.Cancers (Basel). 2021 Feb 13;13(4):788. doi: 10.3390/cancers13040788. Cancers (Basel). 2021. PMID: 33668654 Free PMC article. Review.
-
lncRNA expression in the auditory forebrain during postnatal development.Gene. 2016 Nov 15;593(1):201-216. doi: 10.1016/j.gene.2016.08.027. Epub 2016 Aug 18. Gene. 2016. PMID: 27544636 Free PMC article.
-
Epigenomics reveals a functional genome anatomy and a new approach to common disease.Nat Biotechnol. 2010 Oct;28(10):1049-52. doi: 10.1038/nbt1010-1049. Nat Biotechnol. 2010. PMID: 20944596 Free PMC article.
-
Long non-coding RNAs in corticogenesis: deciphering the non-coding code of the brain.EMBO J. 2015 Dec 2;34(23):2865-84. doi: 10.15252/embj.201592655. Epub 2015 Oct 29. EMBO J. 2015. PMID: 26516210 Free PMC article. Review.
References
-
- Bikfalvi A, Klein S, Pintucci G, Rifkin DB1997. Biological roles of fibroblast growth factor-2. Endocr Rev 18:26–45 - PubMed
-
- Barclay C, Li AW, Geldenhuys L, Baguma-Nibasheka M, Porter GA, Veugelers PJ, Murphy PR, Casson AG2005. Basic fibroblast growth factor (FGF-2) overexpression is a risk factor for esophageal cancer recurrence and reduced survival, which is ameliorated by coexpression of the FGF-2 antisense gene. Clin Cancer Res 11:7683–7691 - PubMed
-
- Giri D, Ropiquet F, Ittmann M1999. Alterations in expression of basic fibroblast growth factor (FGF) 2 and its receptor FGFR-1 in human prostate cancer. Clin Cancer Res 5:1063–1071 - PubMed
-
- Murphy PR, Guo JZ, Friesen HG1990. Messenger RNA stabilization accounts for elevated basic fibroblast growth factor transcript levels in a human astrocytoma cell line. Mol Endocrinol 4:196–200 - PubMed
-
- Murphy PR, Myal Y, Sato Y, Sato R, West M, Friesen HG1989. Elevated expression of basic fibroblast growth factor messenger ribonucleic acid in acoustic neuromas. Mol Endocrinol 3:225–231 - PubMed
Publication types
MeSH terms
Substances
Grants and funding
LinkOut - more resources
Full Text Sources
Molecular Biology Databases
Research Materials
