Comparative Study
. 2010 May;139(5):871-81.
doi: 10.1530/REP-09-0390. Epub 2010 Mar 2.

Profiling of superoxide dismutase isoenzymes in compartments of the developing bovine antral follicles

Affiliations
Comparative Study

Profiling of superoxide dismutase isoenzymes in compartments of the developing bovine antral follicles

Catherine M H Combelles et al. Reproduction. 2010 May.

Abstract

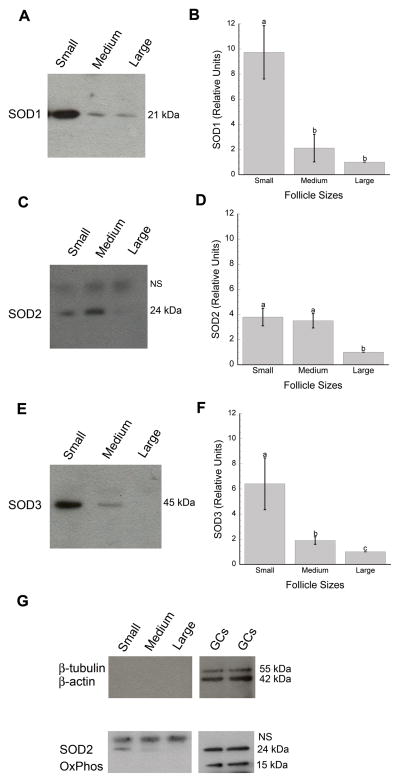
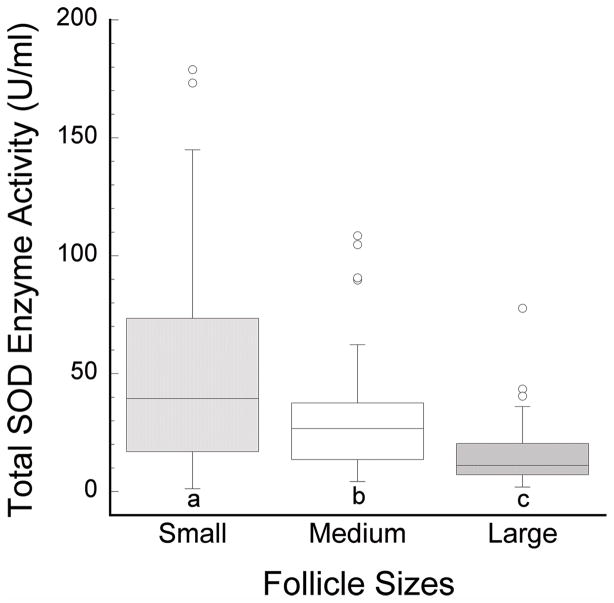
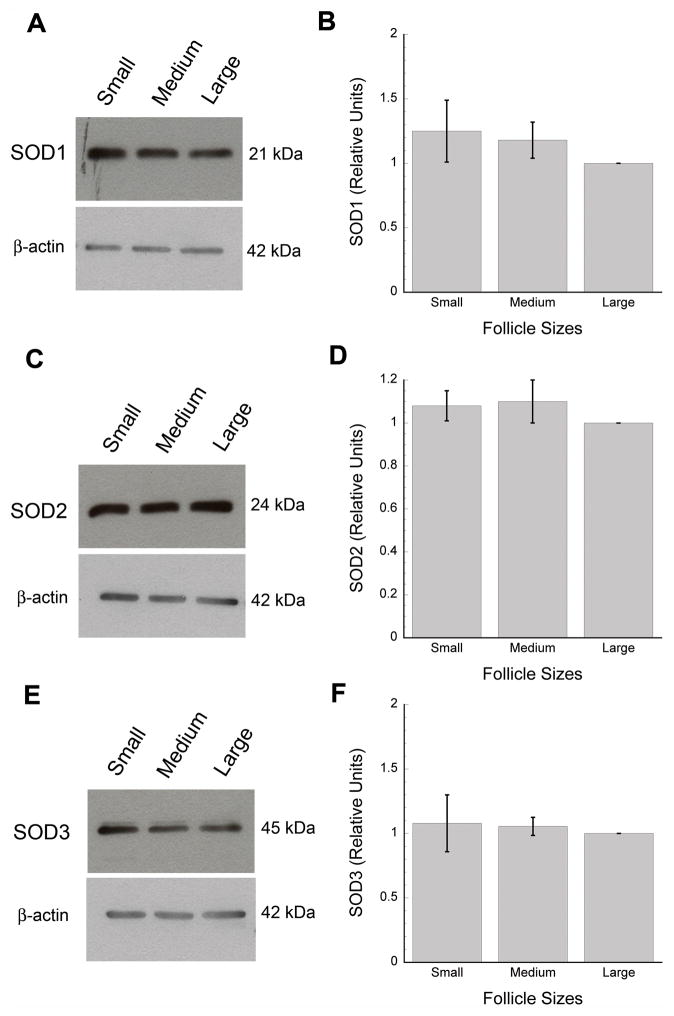
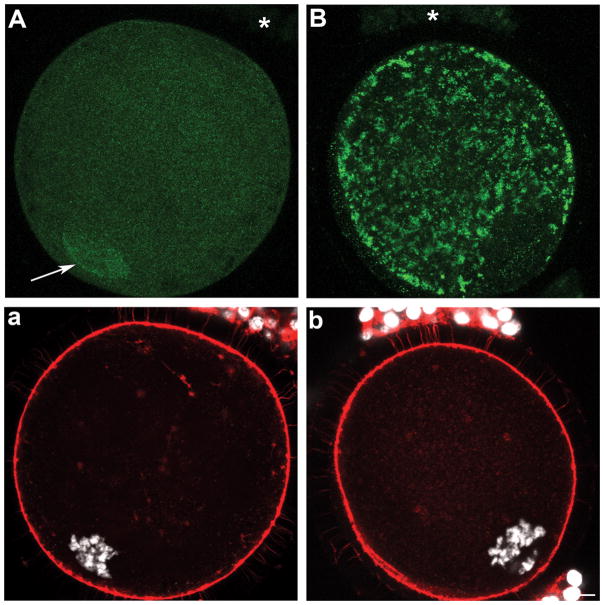
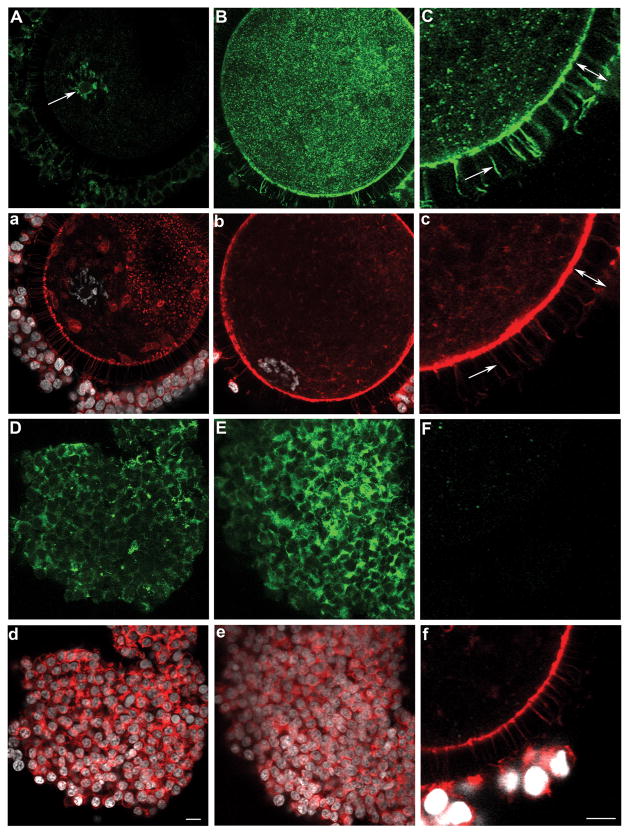
The antral follicle constitutes a complex and regulated ovarian microenvironment that influences oocyte quality. Oxidative stress is a cellular state that may play a role during folliculogenesis and oogenesis, although direct supporting evidence is currently lacking. We thus evaluated the expression of the three isoforms (SOD1, SOD2, and SOD3) of the enzymatic antioxidant superoxide dismutase in all the cellular (granulosa cells, cumulus cells, and oocytes) and extracellular (follicular fluid) compartments of the follicle. Comparisons were made in bovine ovaries across progressive stages of antral follicular development. Follicular fluid possessed increased amounts of SOD1, SOD2, and SOD3 in small antral follicles when compared with large antral follicles; concomitantly, total SOD activity was highest in follicular fluids from smaller diameter follicles. SOD1, SOD2, and SOD3 proteins were expressed in granulosa cells without any fluctuations in follicle sizes. All three SOD isoforms were present, but were distributed differently in oocytes from small, medium, or large antral follicles. Cumulus cells expressed high levels of SOD3, some SOD2, but no detectable SOD1. Our studies provide a temporal and spatial expression profile of the three SOD isoforms in the different compartments of the developing bovine antral follicles. These results lay the ground for future investigations into the potential regulation and roles of antioxidants during folliculogenesis and oogenesis.


Figures

Figure 1
Figure 1
Expression of SOD1 (A–B), SOD2 (C–D), and SOD3 (E–F) proteins in follicular fluids from small (2–5 mm), medium (6–8 mm), and large (>8 mm) antral follicles. Panels A, C, and E show representative immunoblots for SOD1 (21 kDa), SOD2 (24 kDa), and SOD3 (45 kDa). SOD protein concentrations were quantified and reported as arbitrary units relative to a set value of 1 for samples from large follicles (B, D, F: means ± SD’s). Each SOD isoform showed higher protein expression in follicular fluid derived from small when compared to large antral follicles (B, SOD1: (a,b), p<0.001; D, SOD2: (a,b), p=0.001; F, SOD3: (a,c), p<0.001). SOD1 and SOD3 proteins were increased in follicular fluid from small when compared to medium antral follicles (B, F: (a,b), p<0.001). Follicular fluid from large follicles also contained less SOD2 (D: (a,b), p=0.001) and SOD3 (F: (b,c), p=0.002) than fluid from medium follicles. Control blots (G) supported the lack of cytosolic and mitochondrial contaminations with the probing of follicular fluid for β-tubulin/β-actin and OxPhos, respectively. The use of these markers was validated with granulosa cell lysates (GCs) as positive controls. (C, G): NS corresponds to a non-specific band at ~ 25 kDa based on rabbit IgG and secondary antibody alone negative controls.
Figure 2
Figure 2
Total SOD enzyme activity (U/ml) in follicular fluid samples from small (2–5 mm), medium (6–8 mm), and large (> 8 mm) antral follicles. SOD activity is highest in follicular fluids from small antral follicles with greater concentrations in small than medium (a,b: p<0.05), and in medium than in large (b,c: p<0.0005) follicles.
Figure 3
Figure 3
Expression of SOD1 (A–B), SOD2 (C–D), and SOD3 (E–F) proteins in pooled granulosa cell lysates from small (2–5 mm), medium (6–8 mm), and large (>8 mm) antral follicles. Panels A, C, and E show representative immunoblots for each SOD isoenzyme. SOD protein concentrations were quantified and reported as arbitrary units relative to a set value of 1 for samples from large follicles (in B, D, and F, Y-axis values are expressed as means ± SD’s). β-actin was used as a loading control for each SOD blot (A, C, E).
Figure 4
Figure 4
Expression and localization of SOD1 (A) and SOD2 (B) in oocytes and cumulus cells upon isolation from sized antral follicles. Panels a and b show corresponding DNA (white) and microfilaments (red). (A) A fine punctuate SOD1 labelling was localized throughout the ooplasm and nucleoplasm in oocytes from small, medium, and large antral follicles with an enhanced nuclear accumulation indicated by the arrow. SOD1 was not detectable in cumulus cells (A, asterisk). (B) SOD2 was restricted to the ooplasm of oocytes from small, medium, and large follicles, with a detectable but much reduced labelling in cumulus cells (asterisk). (b) Scale bar for all panels: 10 μm.
Figure 5
Figure 5
Expression and localization of SOD3 in oocytes (A–B), trans-zonal projections (C), and cumulus cells (D–E) upon isolation from sized antral follicles. Corresponding microfilament (red) and DNA (white) stains are shown (a–f), and all processing and imaging conditions were kept identical across panels. SOD3 was organized as small aggregates (reminiscent of a vesicular labelling) in the oocyte cortex of oocytes from small (A), medium (C), and large (B) antral follicles. SOD3 was also abundant in cumulus cells and trans-zonal projections (C, c; arrow) with the width of the zona pellucida delineated by a double-ended arrow (C, c). All oocytes had nuclear SOD3, but ones from small (A, a) when compared to large (B, b) follicles showed more SOD3 in the nucleoplasm than ooplasm; SOD3 also co-localized (A, arrow) with chromatin (a). The use of control rabbit IgG antibody (F, f) confirmed the specificity of SOD labelling. (d) Scale bar for all panels except C, c, F, and f for which a scale bar is provided in f: 10μm.

References

    1. Agarwal A, Gupta S, Sekhon L, Shah R. Redox considerations in female reproductive function and assisted reproduction: from molecular mechanisms to health implications. Antioxid Redox Signal. 2008;10:1375–1403. - PubMed
    1. Ali AA, Bilodeau JF, Sirard MA. Antioxidant requirements for bovine oocytes varies during in vitro maturation, fertilization and development. Theriogenology. 2003;59:939–949. - PubMed
    1. Basini G, Simona B, Santini SE, Grasselli F. Reactive oxygen species and anti-oxidant defences in swine follicular fluids. Reprod Fertil Dev. 2008;20:269–274. - PubMed
    1. Behl R, Pandey RS. FSH induced stimulation of catalase activity in goat granulosa cells in vitro. Anim Reprod Sci. 2002;70:215–221. - PubMed
    1. Bertout J, Mahutte NG, Preston SL, Behrman HR. Reactive oxygen species and ovarian function. In: Leung P, Adashi EY, editors. The Ovary. 2. San Diego: Elsevier Academic Press; 2004. pp. 353–368.

Publication types

MeSH terms