Clinical Trial
. 2010 Mar;9(3):751-60.
doi: 10.1158/1535-7163.MCT-09-0868. Epub 2010 Mar 2.

Phase I combination of sorafenib and erlotinib therapy in solid tumors: safety, pharmacokinetic, and pharmacodynamic evaluation from an expansion cohort

Affiliations
Clinical Trial

Phase I combination of sorafenib and erlotinib therapy in solid tumors: safety, pharmacokinetic, and pharmacodynamic evaluation from an expansion cohort

Miguel Quintela-Fandino et al. Mol Cancer Ther. 2010 Mar.

Abstract

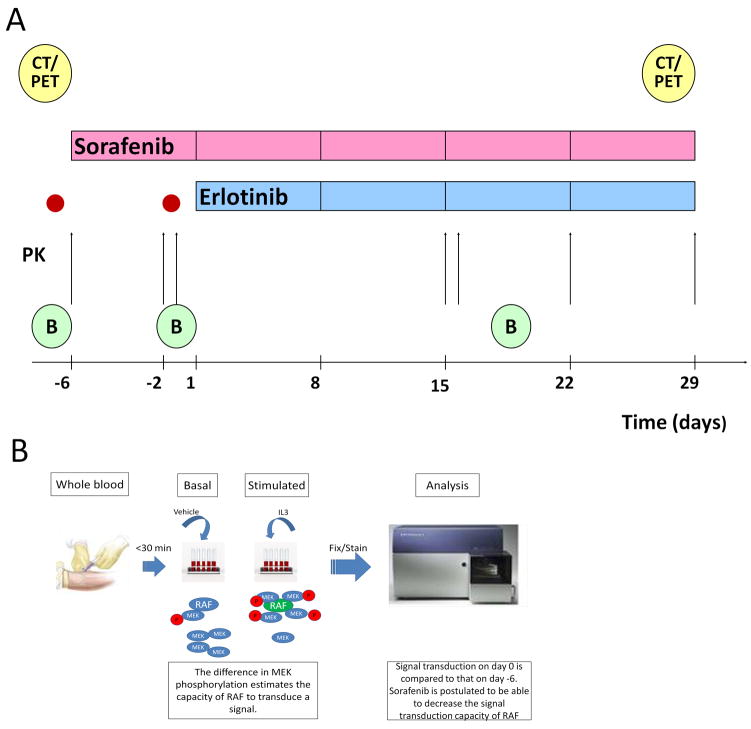
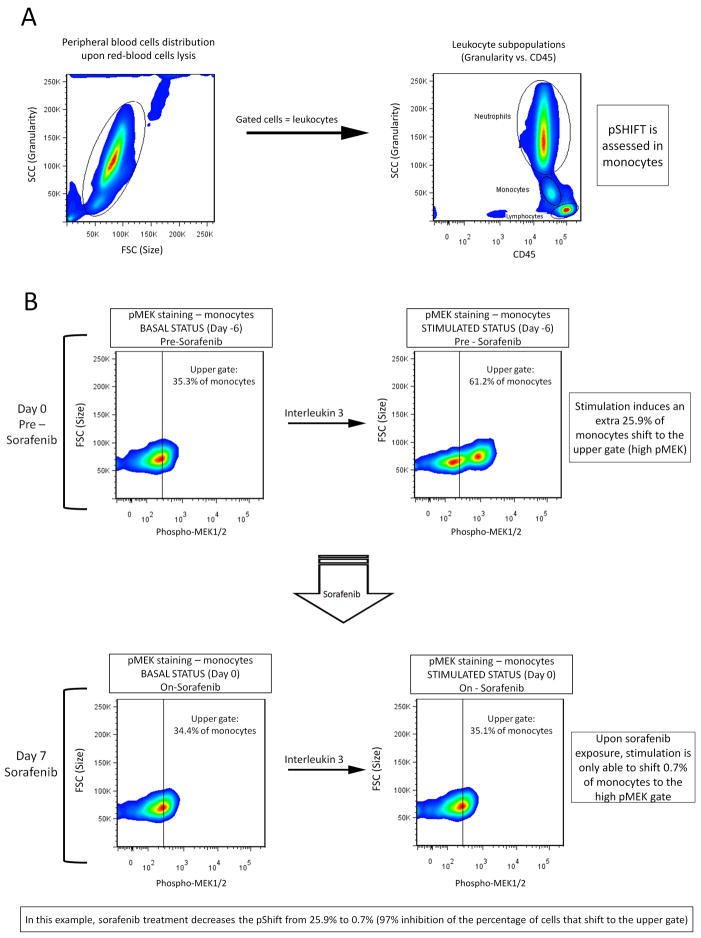
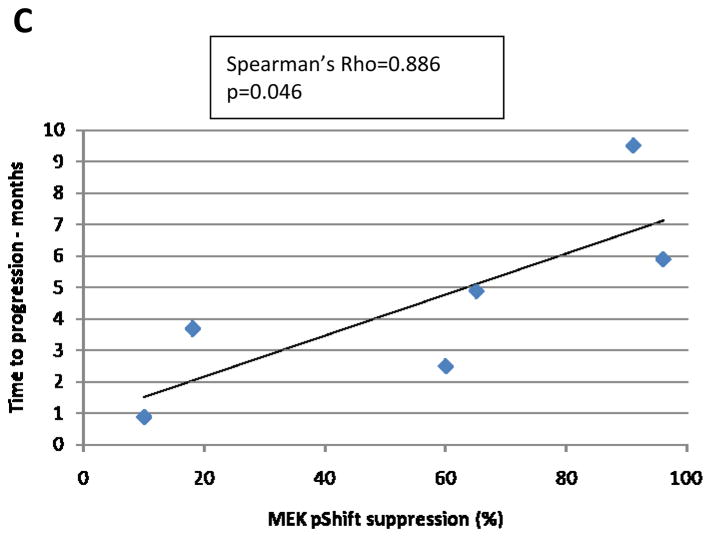
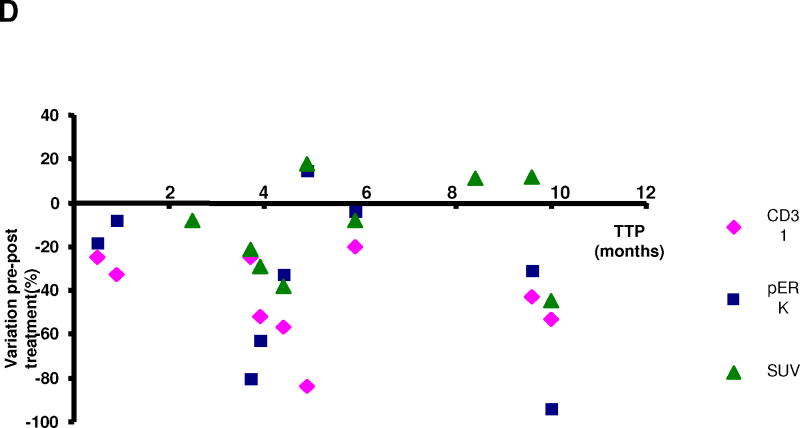
The aims of this study were to further define the safety of sorafenib and erlotinib, given at their full approved monotherapy doses, and to correlate pharmacokinetic and pharmacodynamic markers with clinical outcome. In addition, a novel pharmacodynamic marker based on the real-time measurement of RAF signal transduction capacity (STC) is described. Sorafenib was administered alone for a 1-week run-in period, and then both drugs were given together continuously. RAF STC was assessed in peripheral blood monocytes prior to erlotinib initiation. Epidermal growth factor receptor (EGFR) expression and K-RAS mutations were measured in archival tumor samples. Changes in pERK and CD31 were determined in fresh tumor biopsies obtained pretreatment, prior to erlotinib dosing, and during the administration of both drugs. In addition, positron emission tomography-computed tomography scans and pharmacokinetic assessments were done. Eleven patients received a total of 57 cycles (median, 5; range, 1-10). Only four patients received full doses of both drugs for the entire study course, with elevation of liver enzymes being the main reason for dose reductions and delays. Among 10 patients evaluable for response, 8 experienced tumor stabilization of >or=4 cycles. Pharmacokinetic analysis revealed no significant interaction of erlotinib with sorafenib. Sorafenib-induced decrease in RAF-STC showed statistically significant correlation with time-to-progression in seven patients. Other pharmacodynamic markers did not correlate with clinical outcome. This drug combination resulted in promising clinical activity in solid tumor patients although significant toxicity warrants close monitoring. RAF-STC deserves further study as a predictive marker for sorafenib.


Conflict of interest statement

Conflicts of interest:

Miguel Quintela-Fandino: has conducted research funded by Bayer Pharmaceuticals.

Eric X. Chen: has received honoraria from and conducted research funded by Roche Pharmaceuticals.

Ming Tsao: has exerted compensated advisory role for and received honoraria from Roche Pharmaceuticals.

Lillian L. Siu: has conducted research funded by Bayer Pharmaceuticals.

Figures

Figure 1
Figure 1. Treatment and correlative study schedule
A) PK - arrows: pharmacokinetics sampling; B: tumor biopsy; CT/PET: CT scan and PET scan; red dots: MEK1/2 pShift assessment. B) Schematic representation of the pShift assessment: a blood sample is drawn and processed within 30 minutes. Whole blood is stimulated with vehicle or with IL3 which activates RAF in monocytes. RAF activation recruits and phosphorylates MEK. The difference between the degree of phosphorylation of MEK in the IL3-stimulated aliquots and the vehicle-stimulated aliquots is the pShift. As sorafenib is able to reduce the capacity of RAF to recruit and phosphorylate MEK, the changes in the pShift from day −6 to day 0 may estimate the PD effects of sorafenib on an individual basis.
Figure 2
Figure 2. Pharmacodynamic correlates
A) Gating pathway for identifying monocytes among PBMCs: the left chart plots the cells according to their size and granularity. Gated cells in this chart represent leukocytes. In the right chart, leukocytes are plotted according to their granularity and CD45 staining, defining 3 subpopulations: neutrophils, monocytes and lymphocytes (gated on the chart) B) Example of quantitation of sorafenib-induced MEK1/2 pShift inhibition (samples from patient 5). Monocytes are distributed according to their intracellular phospho-MEK1/2 staining; the “upper gate” is established with a fluorescence value of 281. This value serves as a cutoff value that limits 1/3 of monocytes with the highest pMEK staining in basal conditions in our healthy volunteers. The upper panels show the monocytes response to IL3 stimulation before sorafenib exposure; a large number of monocytes (25.9%) shift to the upper gate. After 7 days of sorafenib treatment (lower panels), the monocytes distribution according to pMEK staining in basal conditions (lower left panel) remains virtually unchanged compared to pre-treatment (upper left panel). However, only an extra 0.7% monocytes are able to shift to the upper gate (lower right panel) upon stimulation. This represents a 97% inhibition of the response to the stimulation or pShift (the average of the three samples for this patient yielded 96%) C) plot showing the correlation between MEK1/2 pShift inhibition and TTP. D) diagram plotting the treatment-induced changes in CD31, pERK and SUV versus TTP.

Similar articles

Cited by

References

    1. Moyer JD, Barbacci EG, Iwata KK, et al. Induction of apoptosis and cell cycle arrest by CP-358,774, an inhibitor of epidermal growth factor receptor tyrosine kinase. Cancer Res. 1997;57:4838–4848. - PubMed
    1. Pollack VA, Savage DM, Baker DA, et al. Inhibition of epidermal growth factor receptor-associated tyrosine phosphorylation in human carcinomas with CP-358,774: dynamics of receptor inhibition in situ and antitumor effects in athymic mice. J Pharmacol Exp Ther. 1999;291:739–748. - PubMed
    1. Adnane L, Trail PA, Taylor I, Wilhelm SM. Sorafenib (BAY 43-9006, Nexavar((R))), a Dual-Action Inhibitor That Targets RAF/MEK/ERK Pathway in Tumor Cells and Tyrosine Kinases VEGFR/PDGFR in Tumor Vasculature. Methods Enzymol. 2005;407:597–612. - PubMed
    1. Mangiameli DP, Blansfield JA, Kachala S, et al. Combination therapy targeting the tumor microenvironment is effective in a model of human ocular melanoma. J Transl Med. 2007;5:38. - PMC - PubMed
    1. Wilhelm SM, Carter C, Tang L, et al. BAY 43-9006 exhibits broad spectrum oral antitumor activity and targets the RAF/MEK/ERK pathway and receptor tyrosine kinases involved in tumor progression and angiogenesis. Cancer Res. 2004;64:7099–7109. - PubMed

Publication types

MeSH terms