

Epigenetic maturation in colonic mucosa continues beyond infancy in mice
- PMID: 20197410
- PMCID: PMC2865374
- DOI: 10.1093/hmg/ddq095
Epigenetic maturation in colonic mucosa continues beyond infancy in mice
Abstract
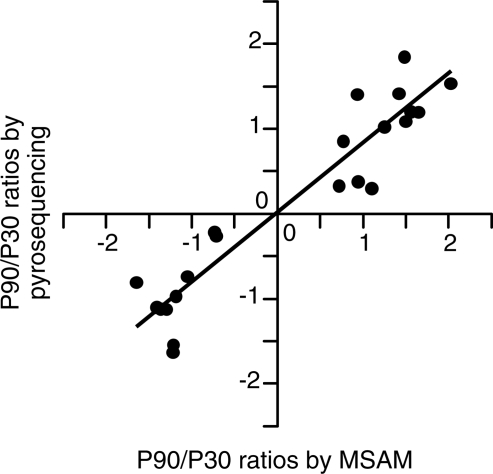
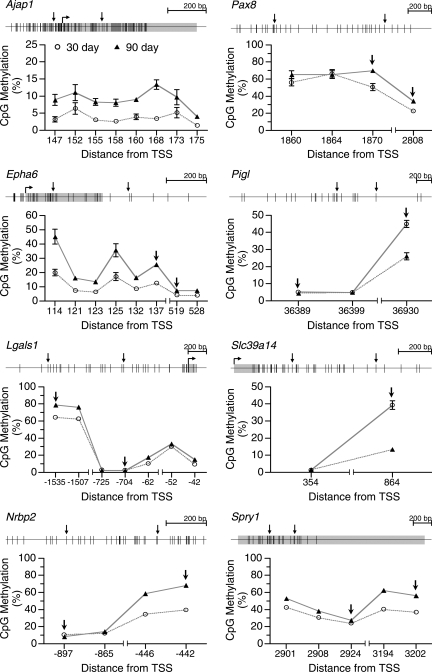
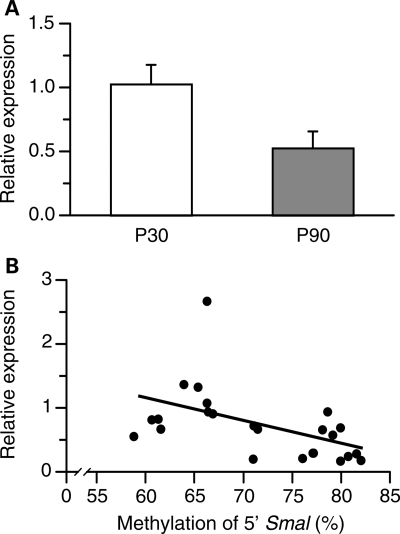
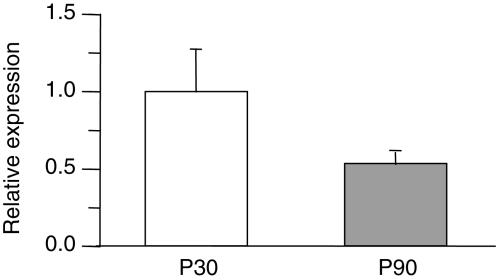
Monozygotic twin and other epidemiologic studies indicate that epigenetic processes may play an important role in the pathogenesis of inflammatory bowel diseases that commonly affect the colonic mucosa. The peak onset of these disorders in young adulthood suggests that epigenetic changes normally occurring in the colonic mucosa shortly before adulthood could be important etiologic factors. We assessed developmental changes in colitis susceptibility during the physiologically relevant period of childhood in mice [postnatal day 30 (P30) to P90] and concurrent changes in DNA methylation and gene expression in murine colonic mucosa. Susceptibility to colitis was tested in C57BL/6J mice with the dextran sulfate sodium colitis model. Methylation specific amplification microarray (MSAM) was used to screen for changes in DNA methylation, with validation by bisulfite pyrosequencing. Gene expression changes were analyzed by microarray expression profiling and real time RT-PCR. Mice were more susceptible to chemically induced colitis at P90 than at P30. DNA methylation changes, however, were not extensive; of 23 743 genomic intervals interrogated, only 271 underwent significant methylation alteration during this developmental period. We found an excellent correlation between the MSAM and bisulfite pyrosequencing at 11 gene associated intervals validated (R(2) = 0.89). Importantly, at the genes encoding galectin-1 (Lgals1), and mothers against decapentaplegic homolog 3 or Smad3, both previously implicated in murine colitis, developmental changes in DNA methylation from P30 to P90 were inversely correlated with expression. Colonic mucosal epigenetic maturation continues through early adulthood in the mouse, and may contribute to the age-associated increase in colitis susceptibility. Transcript Profiling: Gene Expression Omnibus (http://www.ncbi.nlm.nih.gov/geo/), accession numbers: GSE18031 (DNA methylation arrays), GSE19506 (gene expression arrays).
Figures
References
-
- Petronis A., Petroniene R. Epigenetics of inflammatory bowel disease. Gut. 2000;47:302–306. doi:10.1136/gut.47.2.302. - DOI - PMC - PubMed
-
- Petronis A. Epigenetics and twins: three variations on the theme. Trends Genet. 2006;22:347–350. doi:10.1016/j.tig.2006.04.010. - DOI - PubMed
-
- Biank V., Broeckel U., Kugathasan S. Pediatric inflammatory bowel disease: clinical and molecular genetics. Inflamm. Bowel. Dis. 2007;13:1430–1438. doi:10.1002/ibd.20213. - DOI - PubMed
-
- Loftus E.V., Jr Clinical epidemiology of inflammatory bowel disease: incidence, prevalence, and environmental influences. Gastroenterology. 2004;126:1504–1517. doi:10.1053/j.gastro.2004.01.063. - DOI - PubMed
-
- Herrinton L.J., Liu L., Lewis J.D., Griffin P.M., Allison J. Incidence and prevalence of inflammatory bowel disease in a Northern California managed care organization, 1996–2002. Am. J. Gastroenterol. 2008;103:1998–2006. doi:10.1111/j.1572-0241.2008.01960.x. - DOI - PubMed
Publication types
MeSH terms
Substances
Associated data
- Actions
- Actions
Grants and funding
LinkOut - more resources
Full Text Sources
Molecular Biology Databases
Research Materials
Miscellaneous
