. 2010 Mar 15;70(6):2213-23.
doi: 10.1158/0008-5472.CAN-09-1977. Epub 2010 Mar 2.

Complementary actions of inhibitors of angiopoietin-2 and VEGF on tumor angiogenesis and growth

Affiliations

Complementary actions of inhibitors of angiopoietin-2 and VEGF on tumor angiogenesis and growth

Hiroya Hashizume et al. Cancer Res. .

Abstract

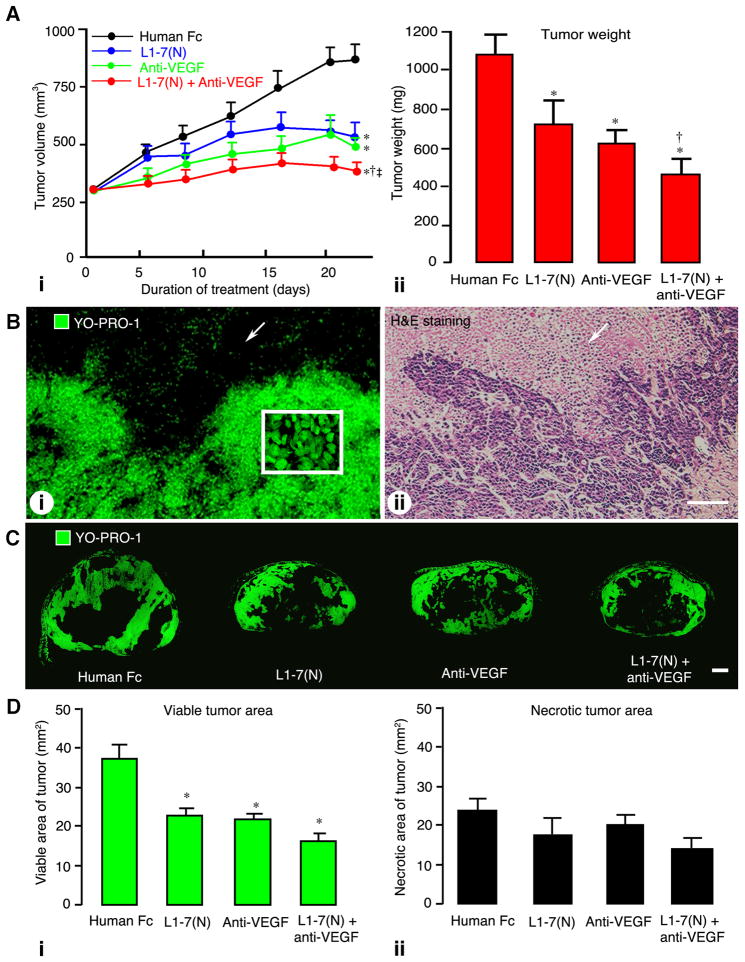
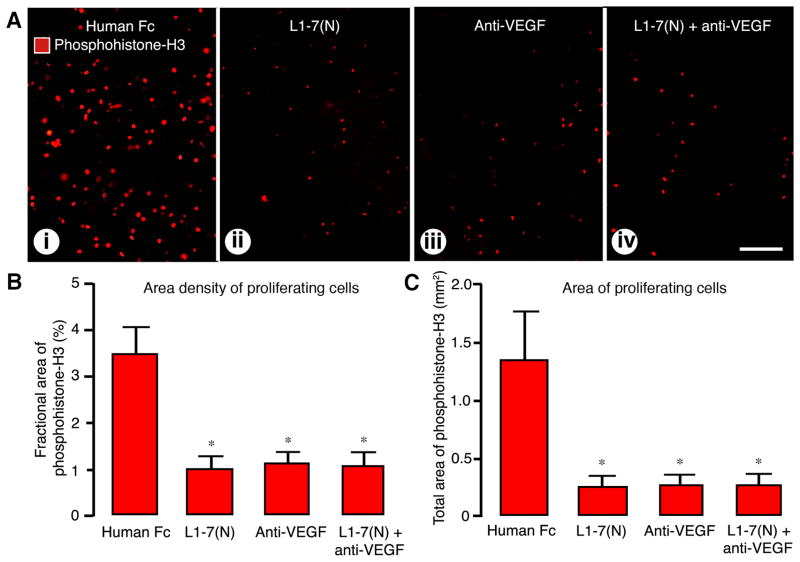
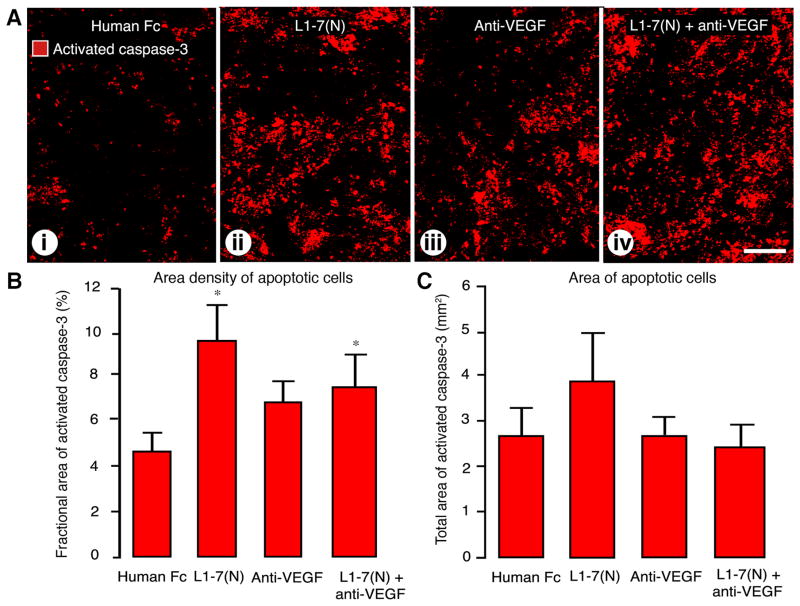
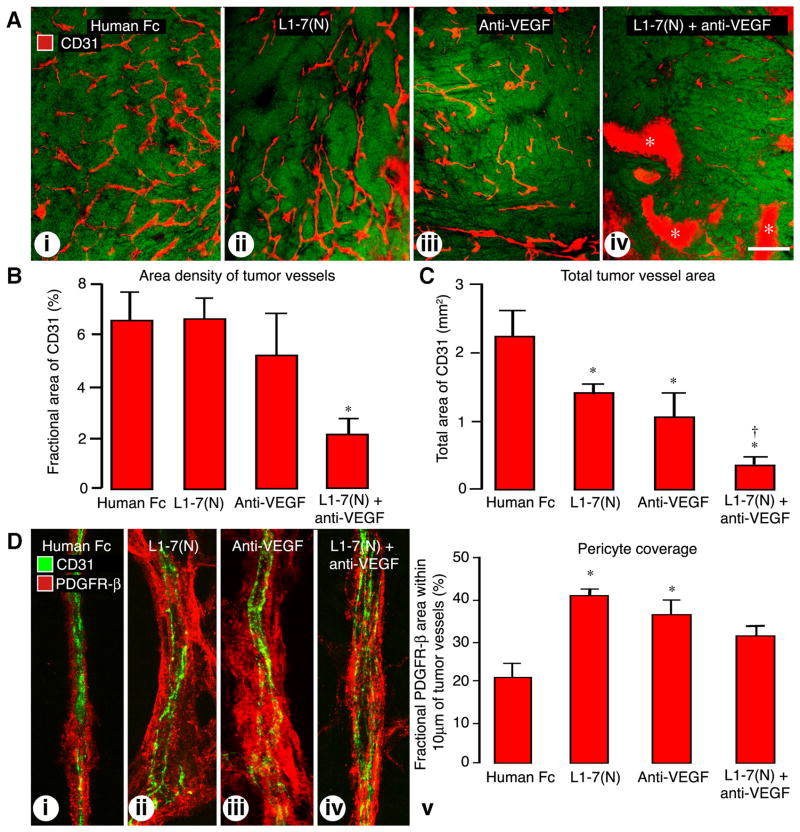
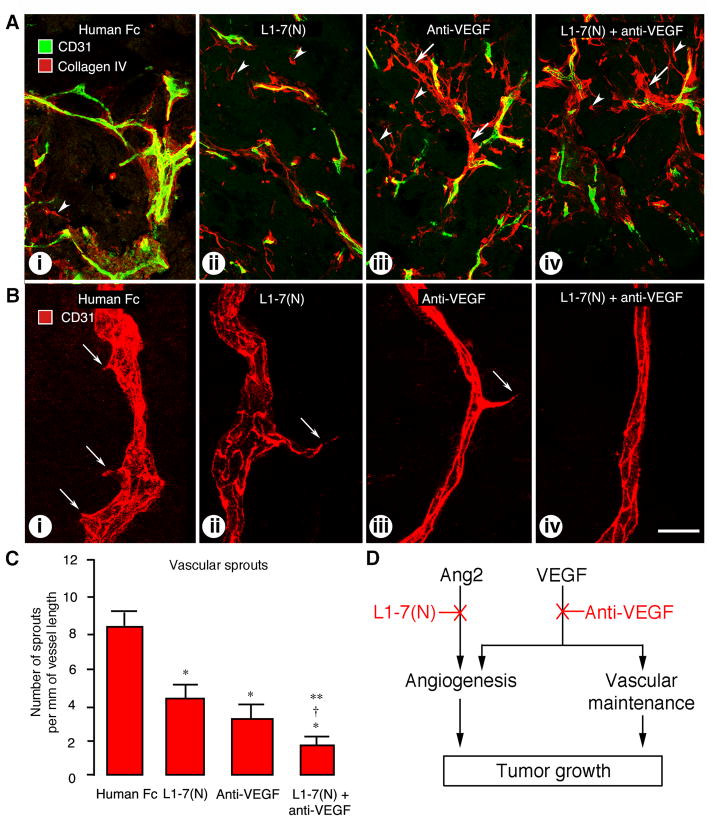
Inhibition of angiopoietin-2 (Ang2) can slow tumor growth, but the underlying mechanism is not fully understood. Because Ang2 is expressed in growing blood vessels and promotes angiogenesis driven by vascular endothelial growth factor (VEGF), we asked whether the antitumor effect of Ang2 inhibition results from reduced sprouting angiogenesis and whether the effect is augmented by inhibition of VEGF from tumor cells. Using Colo205 human colon carcinomas in nude mice as a model, we found that selective inhibition of Ang2 by the peptide-Fc fusion protein L1-7(N) reduced the number of vascular sprouts by 46% and tumor growth by 62% over 26 days. Strikingly, when the Ang2 inhibitor was combined with a function-blocking anti-VEGF antibody, the number of sprouts was reduced by 82%, tumor vascularity was reduced by 67%, and tumor growth slowed by 91% compared with controls. The reduction in tumor growth was accompanied by decreased cell proliferation and increased apoptosis. We conclude that inhibition of Ang2 slows tumor growth by limiting the expansion of the tumor vasculature by sprouting angiogenesis, in a manner that is complemented by concurrent inhibition of VEGF and leads to reduced proliferation and increased apoptosis of tumor cells.


Figures

Figure 1
Figure 1. Changes of tumor growth, weight and viable tumor cells after inhibition of Ang2, VEGF, or both
A: Growth of Colo205 tumors treated with hFc, L1-7(N), anti-VEGF antibody, or the combination. L1-7(N) or anti-VEGF antibody slowed tumor growth and the combination slowed growth even more (i). Tumor weights after 26-days of treatment with hFc, L1-7(N), anti-VEGF antibody, or the combination (ii). B: Colo205 tumor stained with YO-PRO-1 at day 7. Viable tumor (bottom) is distinguishable from necrotic tumor (black, arrow) because of YO-PRO-1 staining of tumor cell nuclei (inset) (i). Hematoxylin and eosin-stained section of Colo205 tumor. Viable tumor with nuclei stained purple (bottom) is clearly distinguishable from diffusely pink stained necrotic regions (arrow) (ii). C: Sections of Colo205 tumors at day 26 after treatment with hFc, L1-7(N), anti-VEGF antibody, or the combination. Compared to hFc treatment, viable tumor stained green with YO-PRO-1 was less after L1-7(N), anti-VEGF antibody, or the drug combination. D: Size of viable tumor after 26-days of treatment. The amount of viable tumor was significantly smaller after treatment with L1-7(N), anti-VEGF antibody, or the combination (i). Tumor necrotic areas were not significantly different after 26-days of treatment (ii). Scale bar in B represents 150μm in (i) and 100μm in (ii). Scale bar in C represents 1mm. * P < 0.05 vs. hFc. † P < 0.05 vs. L1-7(N). ‡ P < 0.05 vs. anti-VEGF.
Figure 2
Figure 2. Treatment-related changes of tumor cell proliferation
A: Phosphohistone-H3 immunoreactivity at day 26 of treatment with hFc (i), L1-7(N) (ii), anti-VEGF antibody (iii), or the combination (iv). Phosphohistone-H3-positive cells in viable regions were abundant after hFc but rare after L1-7(N), anti-VEGF antibody, or the combination. Scale bar: 150μm. B–C: Fractional area (area density) (B) and total area (C) of proliferating tumor cells identified by phosphohistone-H3 immunoreactivity. Fractional area and total area were both significantly less at day 26 after L1-7(N), anti-VEGF antibody, or the combination than after hFc treatment (B–C). *P < 0.05 vs. hFc.
Figure 3
Figure 3. Treatment-related changes in tumor cell apoptosis
A: Activated caspase-3 immunoreactivity after 26-days of hFc (i), L1-7(N) (ii), anti-VEGF antibody (iii), or the combination (iv). Activated caspase-3-positive tumor cells were abundant after L1-7(N) or the combination. Scale bar: 200 μm. B: Fractional areas (area density) of apoptosis assessed by activated caspase-3 immunoreactivity at day 26. Area density of apoptotic cells was greater after L1-7(N) or the combination. C: Total area of activated caspase-3 positive cells was not significantly different among the 4 treatment groups at day 26. * P < 0.05 vs. hFc.
Figure 4
Figure 4. Treatment-related changes of tumor vascularity
A: Fluorescent micrographs of CD31 immunoreactivity (red) in Colo205 tumors at day 26 after hFc (i), L1-7(N) (ii), anti-VEGF antibody (iii), or the combination (iv). The fractional area of CD31-positive blood vessels was less after the combination (iv) than after the other treatments (i–iii). Homogeneous red regions (asterisks in D) indicate non-specific staining of necrotic regions that were not included in measurements. Scale bar: 230μm. B: Fractional area of CD31-immunoreactivity in viable regions after 26 days of treatment with hFc, L1-7(N), anti-VEGF antibody or the combination. At day 26, fractional vessel areas were less after the combination than after treatment with hFc or L1-7(N). C: Total blood vessel area assessed by CD31-immunoreactivity in viable regions at day 26 after hFc, L1-7(N), anti-VEGF antibody, or the combination. At day 26, total vessel areas were less after L1-7(N), anti-VEGF antibody, and the combination than after hFc treatment. The total area after the combination was less than that after L1-7(N). D: Confocal microscopic images of tumor vessels stained for CD31 (endothelial cells, green) and PDGFR-β (pericytes, red). Some pericytes were associated with tumor vessels in controls (hFc; D-i). More pericytes were associated with tumor vessels after treatment with L1-7(N) (ii), anti-VEGF (iii), or the combination (iv). Area density of PDGFR-β staining within 10μm of tumor vessels was significant greater after L1-7(N) or anti-VEGF antibody alone for 26-days (iv). While the value tended to increase after the drug combination, the value did not reach statistical significance. *P < 0.05 vs. hFc, † P < 0.05 vs. L1-7(N).
Figure 5
Figure 5. Empty basement membrane sleeves and endothelial sprouts
A: Fragments of basement membrane (arrowheads, red) were visible in tumors from all treatment groups after staining for type IV collagen (red) and CD31-positive endothelial cells (green). Basement membrane sleeves that lacked endothelial cells were rare or absent in controls (i) or after L1-7(N) (ii) but were frequent after anti-VEGF antibody (iii) or the inhibitor combination for 26 days (iv). B: Blood vessels had multiple sprouts (arrows) after hFc for 26 days (i) and fewer sprouts after L1-7(N) (ii), anti-VEGF antibody (iii), or the combination (iv). Scale bar: 150 μm in A, 20 μm in B. C: Number of sprouts per mm of blood vessel after hFc, L1-7(N), anti-VEGF antibody, or the combination for 26 days. After L1-7(N) and anti-VEGF antibody together, the density of sprouts was significantly less than after hFc. Sprouts were significantly less numerous after the combination than after hFc, L1-7(N), or anti-VEGF antibody. * P < 0.05 vs. hFc, † P < 0.05 vs. L1-7(N), and ** P < 0.05 vs. anti-VEGF antibody. D: Diagram illustrating changes in Colo205 tumors after inhibition of Ang2 and/or VEGF. Inhibition of Ang2 by L1-7(N) reduced angiogenesis. Inhibition of tumor cell-derived VEGF with a function-blocking antibody reduced angiogenesis and also led to vascular regression. These reductions in tumor vessels were accompanied by reduced tumor growth. Inhibition of Ang2 and VEGF together led to greater reduction in tumor vascularity, angiogenesis, and growth.

Similar articles

Cited by

References

    1. Ferrara N, Kerbel RS. Angiogenesis as a therapeutic target. Nature. 2005;438:967–74. - PubMed
    1. Inai T, Mancuso M, Hashizume H, et al. Inhibition of vascular endothelial growth factor (VEGF) signaling in cancer causes loss of endothelial fenestrations, regression of tumor vessels, and appearance of basement membrane ghosts. Am J Pathol. 2004;165:35–52. - PMC - PubMed
    1. Huang J, Frischer JS, Serur A, et al. Regression of established tumors and metastases by potent vascular endothelial growth factor blockade. Proc Natl Acad Sci U S A. 2003;100:7785–90. - PMC - PubMed
    1. Tong RT, Boucher Y, Kozin SV, Winkler F, Hicklin DJ, Jain RK. Vascular normalization by vascular endothelial growth factor receptor 2 blockade induces a pressure gradient across the vasculature and improves drug penetration in tumors. Cancer Res. 2004;64:3731–6. - PubMed
    1. Jain RK. Normalization of tumor vasculature: an emerging concept in antiangiogenic therapy. Science. 2005;307:58–62. - PubMed

Publication types

MeSH terms