. 2010 Mar 15;70(6):2204-12.
doi: 10.1158/0008-5472.CAN-09-3698. Epub 2010 Mar 2.

Simultaneous visualization of protumorigenic Src and MT1-MMP activities with fluorescence resonance energy transfer

Affiliations

Simultaneous visualization of protumorigenic Src and MT1-MMP activities with fluorescence resonance energy transfer

Mingxing Ouyang et al. Cancer Res. .

Abstract

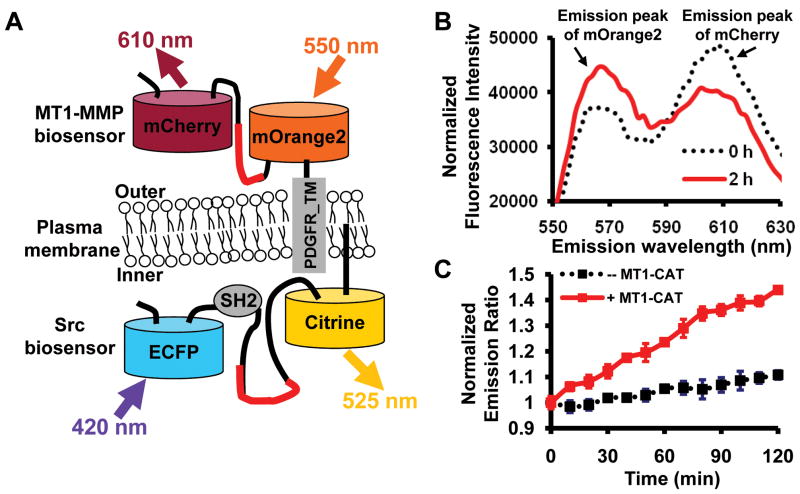
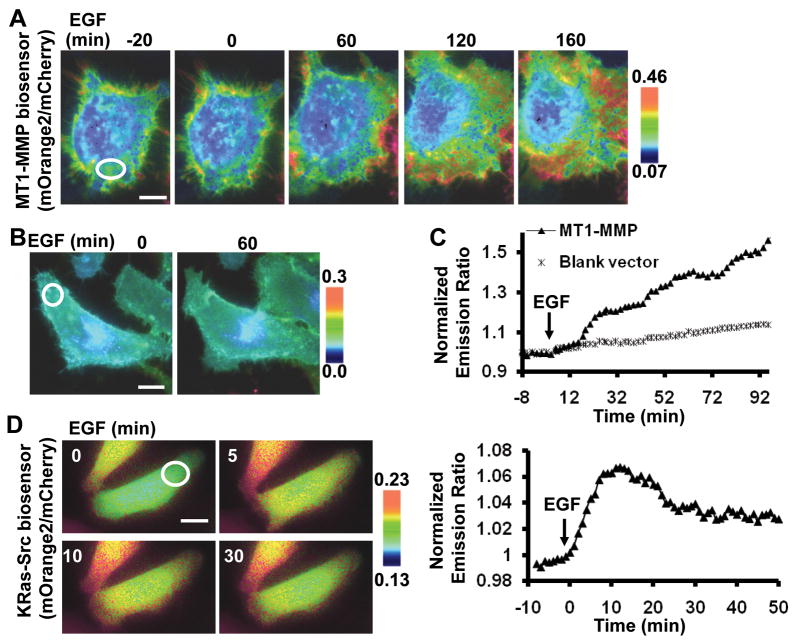
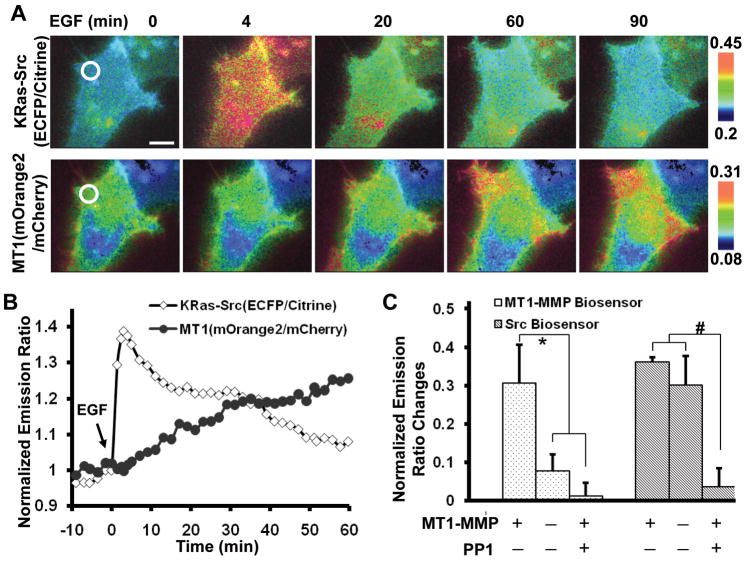
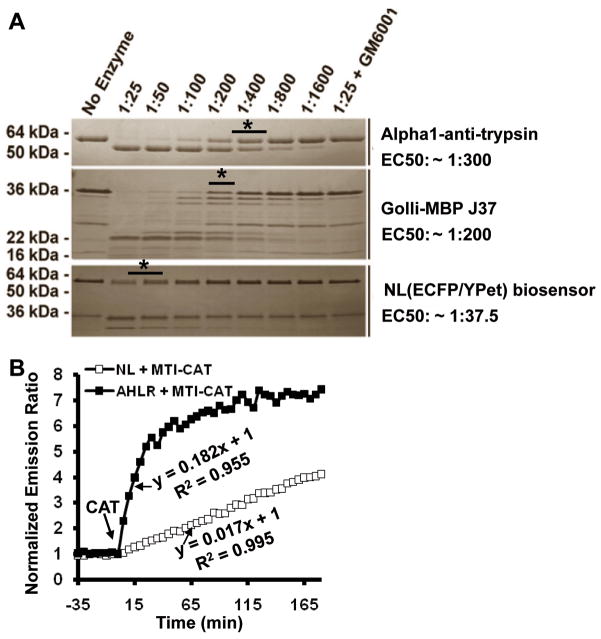
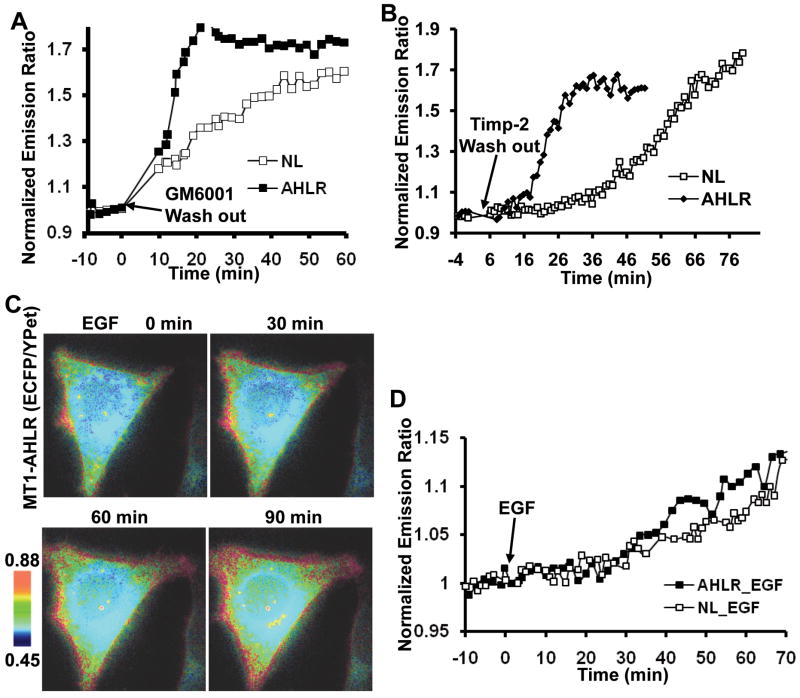
Both Src kinase and membrane type 1 matrix metalloproteinase (MT1-MMP) play critical roles in cancer invasion and metastasis. It is not clear, however, how the spatiotemporal activation of these two critical enzymes is coordinated in response to an oncogenic epithelial growth factor (EGF) stimulation. Here, we have visualized the activities of Src and MT1-MMP concurrently in a single live cell by combining two fluorescence resonance energy transfer (FRET) pairs with distinct spectra: (a) cyan fluorescent protein (CFP) and yellow FP (YFP), and (b) orange FP (mOrange2) and red FP (mCherry). The new FRET pair, mOrange2 and mCherry, was first characterized in vitro and in cultured mammalian cells. When integrated with the CFP/YFP pair, this new pair allowed the revelation of an immediate, rapid, and relatively dispersed Src activity. In contrast, the MT1-MMP activity displayed a slow increase at the cell periphery, although Src was shown to play a role upstream to MT1-MMP globally. This difference in the activation patterns of MT1-MMP and Src in response to EGF is further confirmed using an optimized MT1-MMP biosensor capable of being rapidly cleaved by MT1-MMP. The results indicate that although Src and MT1-MMP act globally in the same signaling pathway, their activations differ in space and time upon EGF stimulation, possibly mediated by different sets of intermediates at different subcellular locations. Our results also showed the potential of mOrange2/mCherry as a new FRET pair, together with the popular variants of CFP and YFP, for the simultaneous visualization of multiple molecular activities in a single live cell.


Figures

Figure 1
Figure 1
The characterization of mOrange2 and mCherry as a FRET pair in vitro. (A) A scheme depicting the membrane-tethered MT1-MMP and Src biosensors. The MT1-MMP biosensor is fused to the transmembrane domain of PDGFR and located outside of the plasma membrane. Src biosensor is anchored at the inner face of the plasma membrane. (B) Emission spectra of purified NL MT1-MMP biosensor based on mOrange2 and mCherry (excited at 515 ± 10 nm) before (black dashed line) and after (red solid line) the addition of 2 μg/ml MT1-CAT for 2 hr at 37°C. Arrows point to the emission peaks of mOrange2 and mCherry. (C) The time courses of mOrange2/mCherry emission ratio (mean ± S.D.) of the MT1-MMP biosensor with (red line) or without (black line) the presence of MT1-CAT.
Figure 2
Figure 2
The characterization of mOrange2 and mCherry as a FRET pair in mammalian cells. (A, B) Representative mOrange2/mCherry emission ratio images of the MT1-MMP biosensor before and after EGF stimulation in HeLa cells expressing (A) MT1-MMP or (B) a blank vector. (C) Representative time courses of normalized mOrange2/mCherry emission ratio of the MT1-MMP biosensor in HeLa cells expressing MT1-MMP (▲) or a blank vector (*). (D) Representative images (left panels) and time course of normalized mOrange2/mCherry emission ratio (right panel) in HeLa cells expressing the Src biosensor before and after EGF stimulation. All the scar bars represent the length of 30 μm.
Figure 3
Figure 3
Concurrently visualizing the MT1-MMP and Src activities. (A) Emission ratio images of HeLa cells expressing Src (ECFP/Citrine, upper panels) and MT1-MMP (mOrange2/mCherry, lower panels) biosensors before and after EGF stimulation. (B) The normalized emission ratio time courses of the KRas-Src and MT1-MMP biosensors averaged on the chosen region of interest as indicated in (A). (C) Bar graphs show the emission ratio changes of the Src (ECFP/Citrine) and MT1-MMP (mOrange2/mCherry) biosensors in response to EGF. ‘MT1-MMP− ’ or ‘MT1-MMP +’: HeLa cells co-transfected with a blank vector or MT1-MMP; ‘PP1 − ’ or ‘PP1 +’: cells pretreated with DMSO or 10 μM PP1 for 1 hr. The * and # signs represent statistically significant difference between the indicated groups.
Figure 4
Figure 4
The development of an optimized MT1-MMP biosensor. (A) The comparison of cleavage speeds of three MT1-MMP substrates (AAT, MBP-J37 and the NL ECFP/YPet biosensor) by MT1-CAT. MT1-CAT was incubated with the different substrate proteins at 1:25–1:1600 molar ratios for 3 h at 37°C. ‘*’ indicates the ratio condition that half of the substrate was cleaved. The corresponding EC50 value was shown at the right side. (B) Comparison of the cleavage speed of the purified NL (□) and AHLR (■) biosensors. The time courses show the normalized emission ratio (ECFP/YPet) change of biosensors (1 μM) before and after the addition of MT1-CAT (2 μg/ml). The equations and R-square values represent the initial slopes of the emission curves upon MT1-CAT incubation.
Figure 5
Figure 5
EGF induced a slow response of the optimized MT1-MMP biosensor. (A and B) The ECFP/YPet emission ratio changes of the NL (□) and AHLR (■) biosensors in response to (A) GM6001 or (B) TIMP-2 washout. HeLa cells expressing MT1-MMP and biosensors were pre-incubated with (A) GM6001 (5 μM) or (B) TIMP-2 (100 nM) for 12 hr, followed by the washout with HBSS or acid/neutralization solutions, respectively. (C) Representative ECFP/YPet emission ratio images of the optimized AHLR FRET biosensor upon EGF stimulation in HeLa cells expressing MT1-MMP. (D) The ECFP/YPet emission ratio time courses of the NL (□) and AHLR (■) biosensors before and after EGF stimulation in HeLa cells expressing MT1-MMP.

Similar articles

Cited by

References

    1. Seiki M. Membrane-type 1 matrix metalloproteinase: a key enzyme for tumor invasion. Cancer Lett. 2003;194:1–11. - PubMed
    1. Osenkowski P, Toth M, Fridman R. Processing, shedding, and endocytosis of membrane type 1-matrix metalloproteinase (MT1-MMP) J Cell Physiol. 2004;200:2–10. - PubMed
    1. Nakahara H, Howard L, Thompson EW, et al. Transmembrane/cytoplasmic domain-mediated membrane type 1-matrix metalloprotease docking to invadopodia is required for cell invasion. Proc Natl Acad Sci U S A. 1997;94:7959–64. - PMC - PubMed
    1. Sternlicht MD, Werb Z. How matrix metalloproteinases regulate cell behavior. Annu Rev Cell Dev Biol. 2001;17:463–516. - PMC - PubMed
    1. Itoh Y, Seiki M. MT1-MMP: a potent modifier of pericellular microenvironment. J Cell Physiol. 2006;206:1–8. - PubMed

Publication types

MeSH terms