. 2010 Mar;22(3):797-810.
doi: 10.1105/tpc.109.073726. Epub 2010 Mar 2.

Internal architecture of mitochondrial complex I from Arabidopsis thaliana

Affiliations

Internal architecture of mitochondrial complex I from Arabidopsis thaliana

Jennifer Klodmann et al. Plant Cell. 2010 Mar.

Abstract

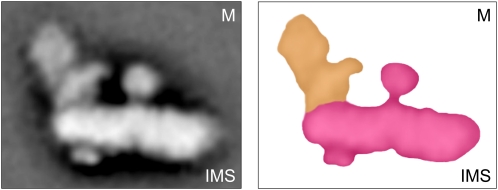
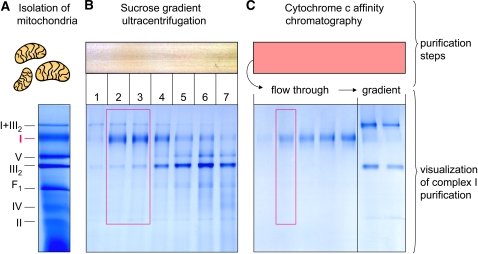
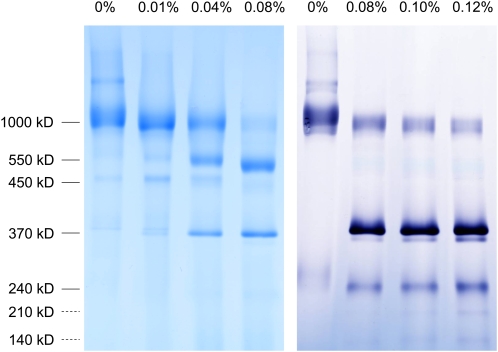
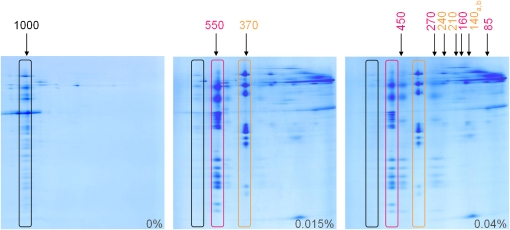
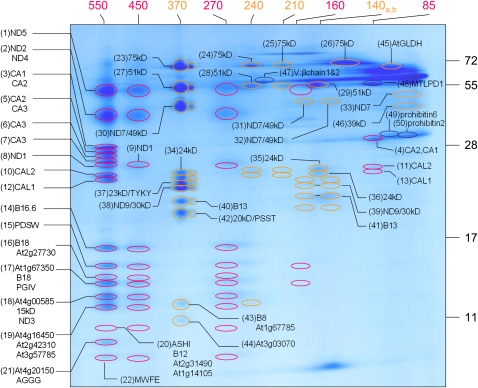
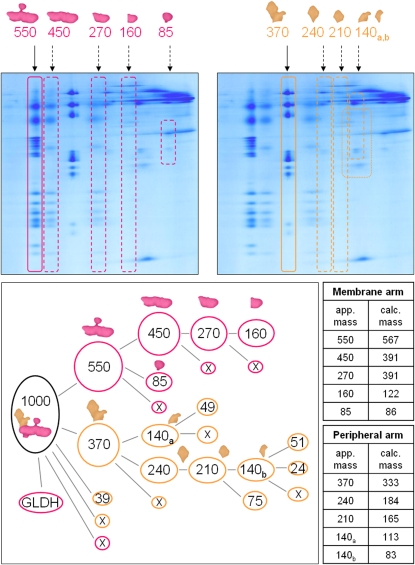
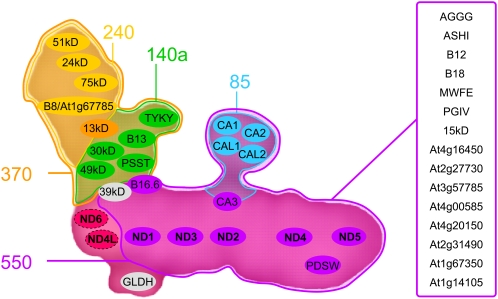
The NADH dehydrogenase complex (complex I) of the respiratory chain has unique features in plants. It is the main entrance site for electrons into the respiratory electron transfer chain, has a role in maintaining the redox balance of the entire plant cell and additionally comprises enzymatic side activities essential for other metabolic pathways. Here, we present a proteomic investigation to elucidate its internal structure. Arabidopsis thaliana complex I was purified by a gentle biochemical procedure that includes a cytochrome c-mediated depletion of other respiratory protein complexes. To examine its internal subunit arrangement, isolated complex I was dissected into subcomplexes. Controlled disassembly of the holo complex (1000 kD) by low-concentration SDS treatment produced 10 subcomplexes of 550, 450, 370, 270, 240, 210, 160, 140, 140, and 85 kD. Systematic analyses of subunit composition by mass spectrometry gave insights into subunit arrangement within complex I. Overall, Arabidopsis complex I includes at least 49 subunits, 17 of which are unique to plants. Subunits form subcomplexes analogous to the known functional modules of complex I from heterotrophic eukaryotes (the so-called N-, Q-, and P-modules), but also additional modules, most notably an 85-kD domain including gamma-type carbonic anhydrases. Based on topological information for many of its subunits, we present a model of the internal architecture of plant complex I.


Figures

Figure 1.
Figure 1.
EM Average Structure and Scheme of Mitochondrial Complex I from Arabidopsis. The EM average structure (left) was taken from Dudkina et al. (2005). The deduced scheme (right) shows the membrane arm of complex I in red and the peripheral arm in orange. The membrane arm is inserted into the inner mitochondrial membrane. M, matrix side; IMS, intermembrane space side.
Figure 2.
Figure 2.
Purification Strategy for Mitochondrial Complex I of Arabidopsis. The three purification steps are shown at the top; after each step, complex I purity was visualized by BN-PAGE and Coomassie blue staining. (A) Mitochondria were isolated from Arabidopsis suspension culture, and total membrane protein was extracted. All OXPHOS complexes are present within this fraction as monitored by BN-PAGE (gel below). Identification of bands was based on subunit composition of the complexes as revealed by second gel dimensions (for comparison, see Eubel et al., 2003). I, II, IV, and V, complexes I, II, IV, and V; F1, F1 part of complex V; III2, dimeric complex III; I+III2, supercomplex composed of complex I and dimeric complex III. (B) The membrane proteins were subsequently separated by sucrose gradient ultracentrifugation. The top of the gradient (small protein complexes) is to the right and the bottom (large protein complexes) to the left. Complex I-containing fractions were identified by BN-PAGE (gel below, rectangle). (C) These fractions were used for cytochrome c affinity chromatography. Complex I was obtained in the flow-through as revealed by BN-PAGE (gel below, rectangle). Finally, complex III2 and the I+III2 supercomplex were eluted from the column with a salt gradient as visible on the BN gel shown below.
Figure 3.
Figure 3.
Controlled Disassembly of Complex I from Arabidopsis by SDS Treatment. Purified complex I was treated with different SDS concentrations to induce its dissection into subcomplexes. The fractions were separated via BN-PAGE. Gels were either stained with Coomassie blue colloidal (left) or by an in-gel activity stain for NADH-dehydrogenase (right). Molecular masses are indicated on the left (in kD), and the SDS-concentrations used for complex I disassembly are given on top of the gels.
Figure 4.
Figure 4.
Analysis of Complex I Subcomplexes by 2D Gel Electrophoresis. Purified complex I was treated with different SDS concentrations as indicated on each gel. Subcomplexes of complex I were separated by 2D BN/SDS-PAGE and visualized by Coomassie blue staining. The holocomplex (1000 kD) is indicated by a black box, and the primarily induced 550-kD subcomplex (representing the membrane arm of complex I) and 370-kD subcomplex (the peripheral arm) are marked by red and orange boxes. Secondary subcomplexes induced by increased destabilization are indicated by arrows above the gel to the right. Their estimated molecular masses are given in orange or red according to their assignment to one of the two primarily induced subcomplexes (see Figures 5 and 8).
Figure 5.
Figure 5.
Identification of Subunits of Complex I Subcomplexes by MS. The complex I fraction was pretreated with 0.04% SDS; subsequently, proteins were resolved by 2D BN/SDS-PAGE. Protein spots were cut out of the gel, digested with trypsin, and analyzed by MS. Spot numbers (in parentheses) refer to those given in Table 1; designations behind the spot numbers correspond to the names of the subunits (see Table 1). Subunits of membrane-embedded complex I subcomplexes are indicated in red, subunits of subcomplexes derived from the peripheral arm in orange, and proteins not belonging to complex I in blue. The sizes of the subcomplexes are indicated above the gel (in kD; red numbers, membrane arm of complex I and subcomplexes; orange, peripheral arm and subcomplexes; 140a,b, two different 140-kD subcomplexes that comigrate on the native gel dimension). The molecular masses of standard proteins are given to the right of the gel.
Figure 6.
Figure 6.
Alignment of At3g03070 with the 13-kD Subunit of Human and Beef Complex I. Amino acid positions identical in all three sequences are highlighted in dark blue and amino acid positions conserved in two sequences in light blue. The orange box indicates peptides identified by MS analyses.
Figure 7.
Figure 7.
Coverage of the CA Sequences by Peptides Identified by MS. The five amino acid sequences of the CA/CA-like subunits of Arabidopsis complex I were aligned using ClustalW2 (http://www.ebi.ac.uk/Tools/clustalw2/index.html). Identified peptides are highlighted in blue. The sequences correspond to the following accessions: At1g19580 (CA1), At1g47260 (CA2), At5g66510.1 (CA3), At5g63510 (CAL1), and At3g48680 (CAL2). The red arrow indicates the cleavage site for the removal of the presequences in CAL1 and CAL2.
Figure 8.
Figure 8.
Proposed Disassembly Process for Arabidopsis Complex I. Top: 2D BN/SDS separations of complex I subcomplexes generated by 0.04% SDS. The membrane arm and its dissection products are indicated on the 2D gel on the left and the peripheral arm and its subcomplexes on the 2D gel to the right. Apparent molecular masses of the subcomplexes are given above the gels (in kD). Bottom: proposed disassembly pathway of Arabidopsis complex I. Membrane subcomplexes/subunits are given in red and the ones of the peripheral arm in orange. Numbers indicate apparent molecular masses (in kD). The table to the right of the scheme compares the apparent molecular masses of the generated complex I subcomplexes with the calculated molecular mass of the sum of their protein subunits identified by MS. Since two subcomplexes deduced from the peripheral arm have apparent molecular masses of 140 kD, these are distinguished in the figure and in the table by (a) and (b). For unknown reasons, the calculated molecular mass of the 270 kD complex is too high.
Figure 9.
Figure 9.
Model of the Internal Architecture of Mitochondrial Complex I from Arabidopsis. Based on the presented disassembly analysis and subunit identifications, the 550-, 370-, 240-, 140-, and 85-kD subcomplexes are assigned to the EM average structure of complex I (Figure 1). The approximate localization of subunits within the subcomplexes is given in accordance with further insights based on the presented findings and data available in the literature (Sazanov and Hinchliffe, 2006; Baranova et al., 2007a, 2007b; Zickermann et al., 2009). The localization of several subunits within the membrane arm of complex I so far is unknown (subunits included in box to the right of the model).

Similar articles

Cited by

References

    1. Abdrakhmanova A., Zickermann V., Bostina M., Radermacher M., Schägger H., Kerscher S., Brandt U. (2004). Subunit composition of mitochondrial complex I from the yeast Yarrowia lipolytica. Biochim. Biophys. Acta 1658: 148–156 - PubMed
    1. Alber B.E., Ferry J.G. (1994). A carbonic anhydrase from the archaeon Methanosarcina thermophila. Proc. Natl. Acad. Sci. USA 91: 6909–6913 - PMC - PubMed
    1. Allen K.D., Staehelin L.A. (1991). Resolution of 16 to 20 chlorophyll-protein complexes using a low ionic strength native green gel system. Anal. Biochem. 194: 214–222 - PubMed
    1. Arizmendi J.M., Skehel J.M., Runswick M.J., Fearnley I.M., Walker J.E. (1992). Complementary DNA sequences of two 14.5 kDa subunits of NADH:ubiquinone oxidoreductase from bovine heart mitochondria. Completion of the primary structure of the complex? FEBS Lett. 313: 80–84 - PubMed
    1. Baranova E.A., Holt P.J., Sazanov L.A. (2007b). Projection structure of the membrane domain of Escherichia coli respiratory complex I at 8 A resolution. J. Mol. Biol. 366: 140–154 - PubMed

Publication types

MeSH terms

LinkOut - more resources