Comparative Study
. 2010 Mar 2;3(111):ra17.
doi: 10.1126/scisignal.2000525.

Crystal structure of the alpha-kinase domain of Dictyostelium myosin heavy chain kinase A

Affiliations
Comparative Study

Crystal structure of the alpha-kinase domain of Dictyostelium myosin heavy chain kinase A

Qilu Ye et al. Sci Signal. .

Abstract

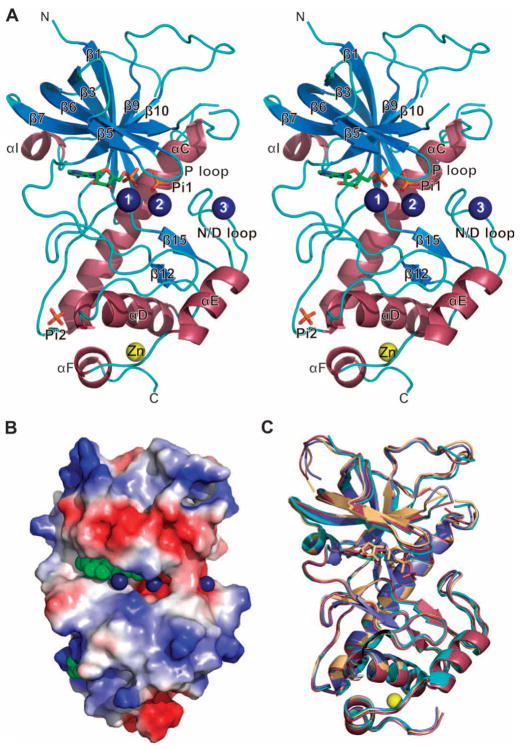
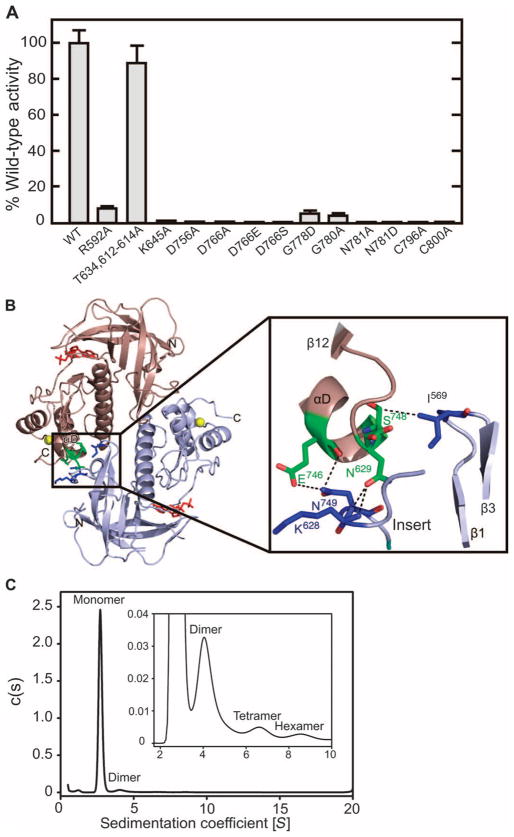
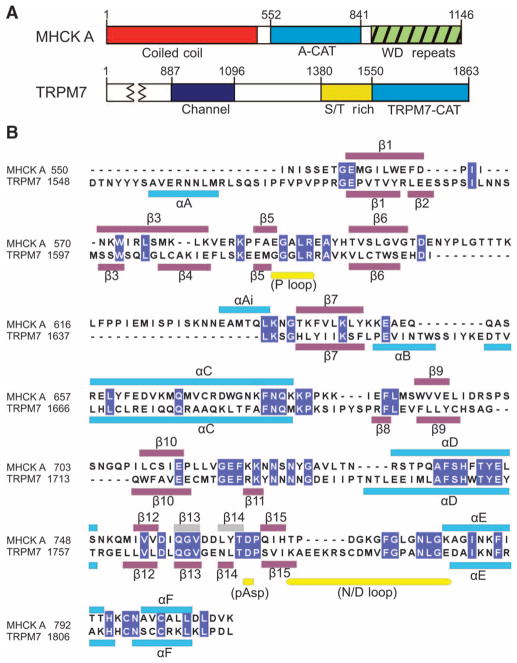
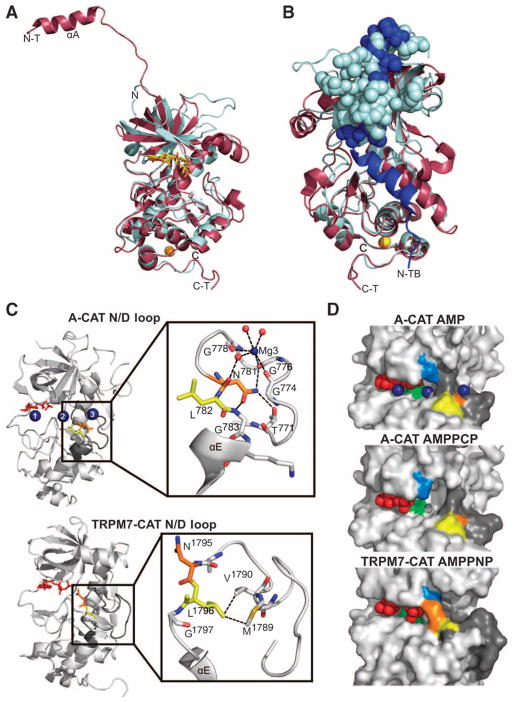
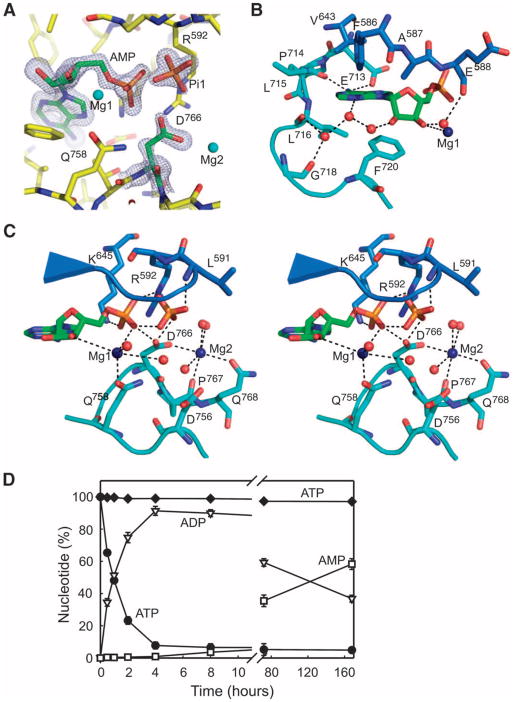
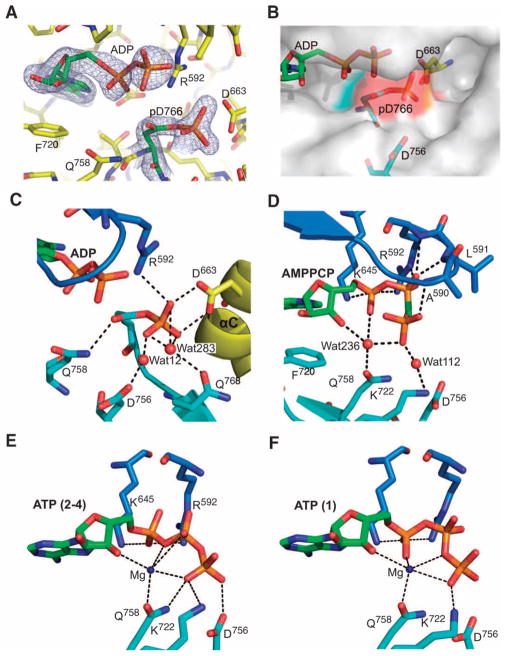
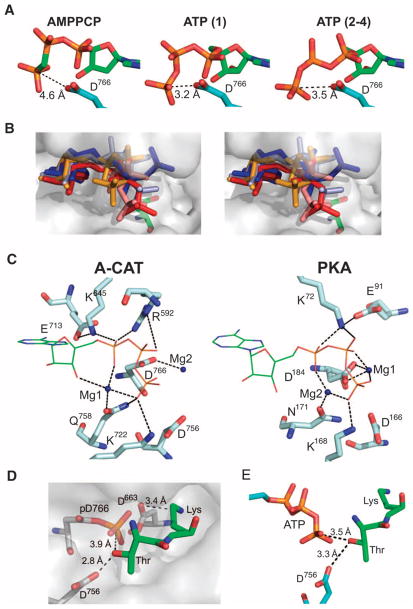
Dictyostelium discoideum myosin II heavy chain kinase A (MHCK A) disrupts the assembly and cellular activity of bipolar filaments of myosin II by phosphorylating sites within its alpha-helical, coiled-coil tail. MHCK A is a member of the atypical alpha-kinase family of serine and threonine protein kinases and displays no sequence homology to typical eukaryotic protein kinases. We report the crystal structure of the alpha-kinase domain (A-CAT) of MHCK A. When crystallized in the presence of adenosine triphosphate (ATP), A-CAT contained adenosine monophosphate (AMP) at the active site. However, when crystallized in the presence of ATP and a peptide substrate, which does not appear in the structure, adenosine diphosphate (ADP) was found at the active site and an invariant aspartic acid residue (Asp(766)) at the active site was phosphorylated. The aspartylphosphate group was exposed to the solvent within an active-site pocket that might function as a docking site for substrates. Access to the aspartylphosphate was regulated by a conformational switch in a loop that bound to a magnesium ion (Mg(2+)), providing a mechanism that allows alpha-kinases to sense and respond to local changes in Mg(2+).


Conflict of interest statement

Competing interests: The authors declare no conflicts of interest.

Figures

Fig. 1
Fig. 1
Structure of A-CAT. (A) A stereo view of the A-CAT–AMP complex with the β strands (blue) and α helices (strawberry) numbered according to the sequence alignment with TRPM7-CAT (see Fig. 4B). Mg2+ ions are rendered as dark blue numbered spheres and the zinc atom as a yellow sphere. AMP, Pi1, and Pi2 are shown as sticks with the C, O, and P atoms colored green, red, and orange, respectively. N and C termini are indicated. (B) Distribution of electrostatic potential shown on the molecular surface of A-CAT. AMP, Pi1, and Pi2 are rendered as green spheres and the Mg2+ ions as dark blue spheres. (C) Superimposed structures of the A-CAT–AMPPCP (light orange), A-CAT–AMP (cyan), A-CAT–ADP (blue), and A-CAT-D766A–ATP complexes (raspberry). Nucleotides in each complex are shown as sticks of the same color, and the zinc atom is depicted as a yellow sphere. All diagrams of the structure of A-CAT were generated with PyMOL (http://www.pymol.org).
Fig. 2
Fig. 2
Mutational analysis and intermolecular interactions. (A) Wild-type (WT) A-CAT and the indicated site-directed A-CAT mutant proteins were assayed for kinase activity in experiments with myelin basic protein as the substrate as described in Materials and Methods. The activity of each mutant protein is expressed as a percentage of that of WT A-CAT. Error bars represent the SD, and the data are representative of five experiments. (B) The ribbon diagram shows molecule 1 (salmon) and molecule 2 (light blue) in the asymmetric unit of the A-CAT–AMPPCP complex (left). Nucleotides are shown as red sticks and the zinc atoms as yellow spheres. The region enclosed by the box shows residues in the αD to β12 turn in molecule 1 (green) that interact with residues in molecule 2 (dark blue). An expanded view of this region is shown in the box on the right. Dashed lines indicate the interactions between the residues. (C) Sedimentation velocity analysis of A-CAT. The main graph shows the full species distribution, whereas in the inset, the vertical scale is magnified by a factor of 50 to better show the minor components. c(s), continuous sedimentation coefficient distribution. A monomer peak at 2.7S, a dimer peak at 4.1S, a tetramer peak at 6.6S, and a hexamer peak at 8.6S were resolved, which constituted 91.2, 3.4, 1.4, and 0.7% of the total amount of protein, respectively. The data are representative of three separate experiments.
Fig. 3
Fig. 3
Alignment of the sequences of the α-kinase domains of MHCK A and TRPM7. (A) The diagrams show the domain structures of Dictyostelium MHCK A and mouse TRPM7. S/T, serine-threonine. (B) The α-kinase domains of Dictyostelium MHCK A and mouse TRPM7 (UniprotKB accession codes Q54EX1 and Q923J1, respectively) were aligned on the basis of similarities in their sequence and structure. The positions of the β strands (purple boxes) and α helices (blue boxes) in the structures of the A-CAT–AMPPCP complex and the TRPM7-CAT–AMPPNP complex are shown above and below the alignment, respectively. β strands 13 and 14 (gray boxes) appear in some, but not all, of the structures of A-CAT. Yellow boxes below the alignment indicate the P loop, A-CAT insert, phosphorylated aspartate residue (pAsp), and the N/D loop. Identical residues in A-CAT–AMPPCP and TRPM7-CAT–AMPPNP are shown in white text on a blue background. Abbreviations for the amino acid residues are as follows: A, Ala; C, Cys; D, Asp; E, Glu; F, Phe; G, Gly; H, His; I, Ile; K, Lys; L, Leu; M, Met; N, Asn; P, Pro; Q, Gln; R, Arg; S, Ser; T, Thr; V, Val; W, Trp; and Y, Tyr.
Fig. 4
Fig. 4
Comparison of the structures of A-CAT and TRPM7-CAT. (A) Front view of the superimposed structures of A-CAT (cyan) and TRPM7-CAT (raspberry) (PDB code 1IA9). In both structures, the nucleotide and zinc atoms are colored yellow and orange, respectively. N and C refer to the N terminus and C terminus, respectively, of A-CAT, whereas N-T and C-T refer to the N terminus and C terminus, respectively, of TRPM7-CAT. (B) Rear view of the superimposed structures showing the N-terminal extension (residues 1549 to 1577) from the second subunit (chain B) of TRPM7-CAT in the dimer in dark blue. For clarity, the N-terminal extension of the first TRPM7-CAT molecule (chain A) is omitted. Amino acid residues 1567 to 1577 of chain B and residues 604 to 624 of A-CAT (the insert) are rendered as spheres. N-TB indicates the N terminus of chain B and C-T denotes the C terminus of chain A. (C) The location of the N/D loop (dark gray) in the context of the entire structure of A-CAT (top panel) and TRPM7-CAT (bottom panel) is shown on the left, with the nucleotide shown as red sticks, the Mg2+ ions as dark blue spheres, the invariant Asn781 and Asn1795 residues colored in orange, and the conserved Leu782 and Leu1796 residues in yellow. An expanded view of the N/D loop is shown on the right, with water molecules illustrated as red spheres. Interactions made by Mg3, Asn781, and Leu1796 are shown as dashed lines. The interaction distances for Mg3 are given in table S1. (D) Surface representations of A-CAT and TRPM7-CAT highlighting the active-site pocket. The color scheme is the same as that used in (C). Leu591 in the P loop of A-CAT (Leu1621 in TRPM7-CAT) is colored marine blue and the catalytic Asp766 of A-CAT (Asp1775 in TRPM7-CAT) is colored green. Asn781 in the center of the N/D loop is far from the active site of A-CAT, whereas Asn1795, which is flipped out of the N/D loop, blocks access to the active-site pocket of TRPM7-CAT.
Fig. 5
Fig. 5
Active-site interactions with AMP, Pi1, Mg1, and Mg2. (A) The 2FoFc electron density map, contoured at the 2σ level (gray mesh), of AMP, Pi1, and Asp766 in the active site of A-CAT. Mg1 and Mg2 are shown as cyan spheres. (B) Summary of the interactions made by the adenine base and ribose moiety of AMP (green) with residues from the N-terminal (blue) and C-terminal (cyan) lobes of A-CAT. Ordered water molecules are shown as red spheres and Mg1 as a dark blue sphere. Interactions are indicated by dashed lines. (C) A stereo view of the active site of A-CAT showing interactions made by the α-phosphate of AMP, Pi1, Mg1, and Mg2. The color scheme is the same as that used in (B). Interactions are indicated by dashed lines, and the distances involved are provided in table S1. (D) Time course of the hydrolysis of [α-32P]ATP by A-CAT (black circles) and A-CAT-D766A (black diamonds). A-CAT, but not A-CAT-D766A, hydrolyzed ATP to ADP (open triangles) and AMP (open squares). Error bars show the SD for three independent experiments, carried out as described in Materials and Methods.
Fig. 6
Fig. 6
Active-site interactions with pAsp766, ATP, and AMPPCP. (A) The 2FoFc electron density map of ADP and pAsp766 (pD766) contoured at 2σ (gray mesh). Residues are shown as yellow sticks, with ADP and pAsp766 shown as green sticks. (B) A surface representation of the structure of A-CAT–ADP showing the location of pAsp766 near to the entrance of the active-site pocket. The surface area contributed by the aspartylphosphate residue is colored in red. (C to F) The interactions made by (C) pAsp766, (D) the AMPPCP phosphoryl groups, (E) the ATP phosphoryl groups in molecules 2 to 4, and (F) the ATP phosphoryl groups in molecule 1 of the four-molecule asymmetric unit of A-CAT-D766A. The color scheme used in (C) to (F) is the same as that used in Fig. 5B. Interactions are indicated by dashed lines.
Fig. 7
Fig. 7
ATP and peptide substrate binding. (A) The positions of the γ-phosphoryl groups of ATP and AMPPCP relative to the side chain of Asp766. ATP adopts different conformations in molecule 1 and molecules 2 to 4 of the asymmetric unit of A-CAT-D766A. Aspartic acid was modeled in place of Ala766 in the structure of A-CAT-D766A. (B) The stereo view shows the superimposed structures of AMPPCP in A-CAT (orange), ATP in molecule 1 (salmon), ATP in molecules 2 to 4 of A-CAT-D766A (red), and AMPPNP in chain A (light blue) and chain B (dark blue) of TRPM7-CAT. The surface representation is of the A-CAT–AMPPCP complex with Asp766 rendered as green sticks. (C) Comparison of the active sites of A-CAT (left panel) and PKA (right panel) showing key catalytic residues, ATP (thin green sticks), and Mg2+ ions (dark blue spheres). The high- and low-affinity Mg2+ ions bound to PKA are labeled Mg1 and Mg2, respectively. (D) A Thr-Lys dipeptide (green sticks) was docked into the active-site pocket of the A-CAT–ADP complex (surface shown in gray). (E) The Thr-Lys dipeptide, in the same position and configuration as that shown in (D), was docked onto the ACAT-D766A–ATP complex.

References

    1. Vicente-Manzanares M, Ma X, Adelstein RS, Horwitz AR. Non-muscle myosin II takes centre stage in cell adhesion and migration. Nat Rev Mol Cell Biol. 2009;10:778–790. - PMC - PubMed
    1. De la Roche MA, Smith JL, Betapudi V, Egelhoff TT, Côté GP. Signaling pathways regulating Dictyostelium myosin II. J Muscle Res Cell Motil. 2002;23:703–718. - PubMed
    1. Yumura S, Yoshida M, Betapudi V, Licate LS, Iwadate Y, Nagasaki A, Uyeda TQ, Egelhoff TT. Multiple myosin II heavy chain kinases: Roles in filament assembly control and proper cytokinesis in Dictyostelium. Mol Biol Cell. 2005;16:4256–4266. - PMC - PubMed
    1. Bosgraaf L, van Haastert PJ. The regulation of myosin II in Dictyostelium. Eur J Cell Biol. 2006;85:969–979. - PubMed
    1. Côté GP, Bukiejko U. Purification and characterization of a myosin heavy chain kinase from Dictyostelium discoideum. J Biol Chem. 1987;262:1065–1072. - PubMed

Publication types

MeSH terms

LinkOut - more resources