

Crystal structure and functional interpretation of the erythrocyte spectrin tetramerization domain complex
- PMID: 20197550
- PMCID: PMC2890174
- DOI: 10.1182/blood-2010-01-261396
Crystal structure and functional interpretation of the erythrocyte spectrin tetramerization domain complex
Abstract
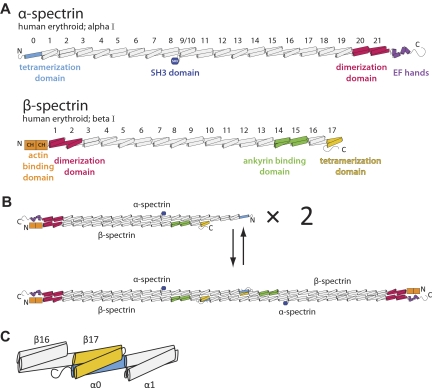
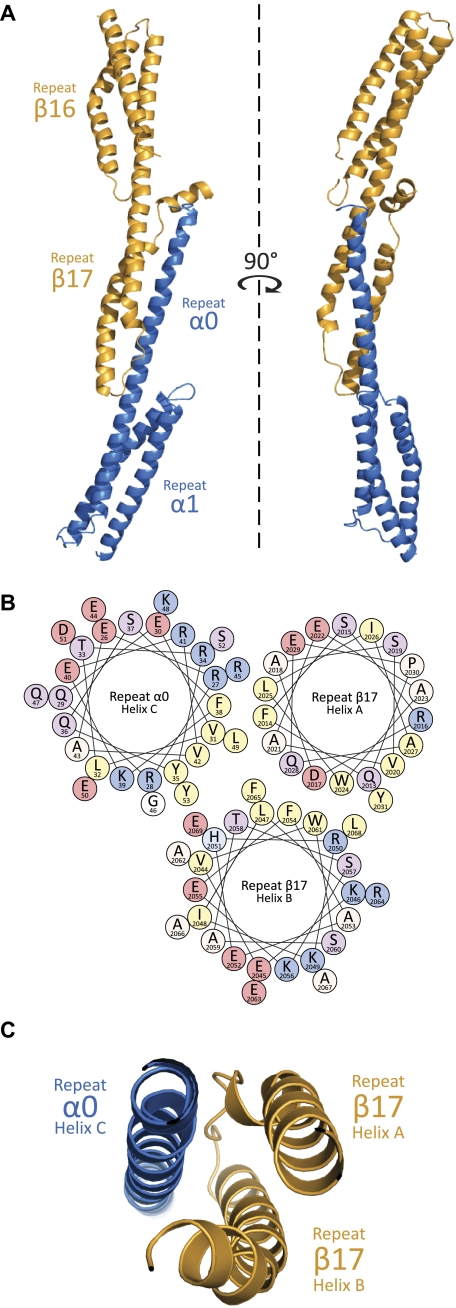
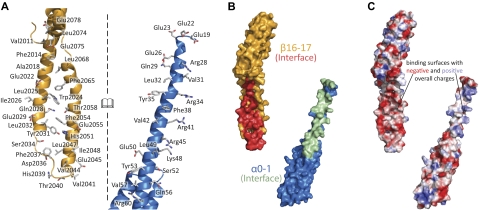
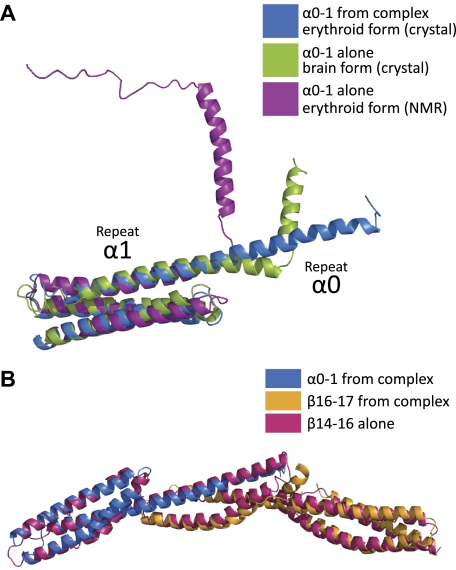
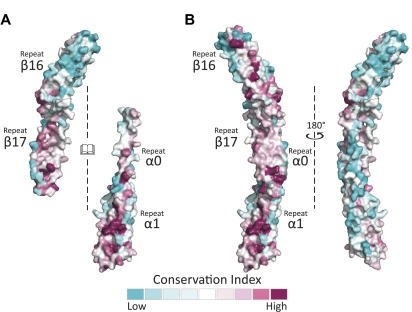
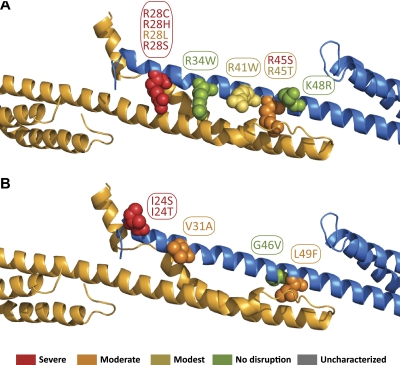
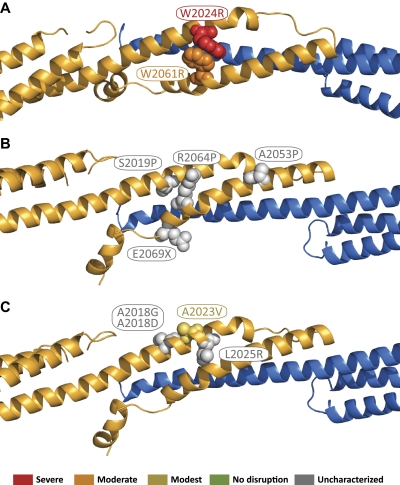
As the principal component of the membrane skeleton, spectrin confers integrity and flexibility to red cell membranes. Although this network involves many interactions, the most common hemolytic anemia mutations that disrupt erythrocyte morphology affect the spectrin tetramerization domains. Although much is known clinically about the resulting conditions (hereditary elliptocytosis and pyropoikilocytosis), the detailed structural basis for spectrin tetramerization and its disruption by hereditary anemia mutations remains elusive. Thus, to provide further insights into spectrin assembly and tetramer site mutations, a crystal structure of the spectrin tetramerization domain complex has been determined. Architecturally, this complex shows striking resemblance to multirepeat spectrin fragments, with the interacting tetramer site region forming a central, composite repeat. This structure identifies conformational changes in alpha-spectrin that occur upon binding to beta-spectrin, and it reports the first structure of the beta-spectrin tetramerization domain. Analysis of the interaction surfaces indicates an extensive interface dominated by hydrophobic contacts and supplemented by electrostatic complementarity. Analysis of evolutionarily conserved residues suggests additional surfaces that may form important interactions. Finally, mapping of hereditary anemia-related mutations onto the structure demonstrate that most, but not all, local hereditary anemia mutations map to the interacting domains. The potential molecular effects of these mutations are described.
Figures
Similar articles
-
The common hereditary elliptocytosis-associated α-spectrin L260P mutation perturbs erythrocyte membranes by stabilizing spectrin in the closed dimer conformation.Blood. 2013 Oct 24;122(17):3045-53. doi: 10.1182/blood-2013-02-487702. Epub 2013 Aug 23. Blood. 2013. PMID: 23974198 Free PMC article.
-
Structural basis for spectrin recognition by ankyrin.Blood. 2010 May 20;115(20):4093-101. doi: 10.1182/blood-2009-11-255604. Epub 2010 Jan 25. Blood. 2010. PMID: 20101027 Free PMC article.
-
Spectrin oligomerization is cooperatively coupled to membrane assembly: a linkage targeted by many hereditary hemolytic anemias?Exp Mol Pathol. 2001 Jun;70(3):215-30. doi: 10.1006/exmp.2001.2377. Exp Mol Pathol. 2001. PMID: 11418000
-
[Disorders of the membrane skeleton of erythrocytes in hereditary spherocytosis and elliptocytosis: significance of the molecular defect for pathogenesis and clinical severity].Klin Padiatr. 1991 Jul-Aug;203(4):284-95. doi: 10.1055/s-2007-1025443. Klin Padiatr. 1991. PMID: 1942935 Review. German.
-
Hereditary elliptocytosis: spectrin and protein 4.1R.Semin Hematol. 2004 Apr;41(2):142-64. doi: 10.1053/j.seminhematol.2004.01.003. Semin Hematol. 2004. PMID: 15071791 Review.
Cited by
-
Erythrocyte membrane changes of chorea-acanthocytosis are the result of altered Lyn kinase activity.Blood. 2011 Nov 17;118(20):5652-63. doi: 10.1182/blood-2011-05-355339. Epub 2011 Sep 27. Blood. 2011. PMID: 21951684 Free PMC article.
-
Aberrant splicing contributes to severe α-spectrin-linked congenital hemolytic anemia.J Clin Invest. 2019 Apr 30;129(7):2878-2887. doi: 10.1172/JCI127195. J Clin Invest. 2019. PMID: 31038472 Free PMC article.
-
The role of βII spectrin in cardiac health and disease.Life Sci. 2018 Jan 1;192:278-285. doi: 10.1016/j.lfs.2017.11.009. Epub 2017 Nov 9. Life Sci. 2018. PMID: 29128512 Free PMC article. Review.
-
Crystal structure of a rigid four-spectrin-repeat fragment of the human desmoplakin plakin domain.J Mol Biol. 2011 Jun 24;409(5):800-12. doi: 10.1016/j.jmb.2011.04.046. Epub 2011 Apr 22. J Mol Biol. 2011. PMID: 21536047 Free PMC article.
-
Large-scale modelling of the divergent spectrin repeats in nesprins: giant modular proteins.PLoS One. 2013 May 6;8(5):e63633. doi: 10.1371/journal.pone.0063633. Print 2013. PLoS One. 2013. PMID: 23671687 Free PMC article.
References
-
- Bennett V. Ankyrins. Adaptors between diverse plasma membrane proteins and the cytoplasm. J Biol Chem. 1992;267(13):8703–8706. - PubMed
-
- Mohandas N, Evans E. Mechanical properties of the red cell membrane in relation to molecular structure and genetic defects. Annu Rev Biophys Biomol Struct. 1994;23(1):787–818. - PubMed
-
- Tse WT, Lux SE. Red blood cell membrane disorders. Br J Haematol. 1999;104(1):2–13. - PubMed
-
- Delaunay J. The molecular basis of hereditary red cell membrane disorders. Blood Rev. 2007;21(1):1–20. - PubMed
-
- Gallagher PG. Hereditary elliptocytosis: spectrin and protein 4.1R. Semin Hematol. 2004;41(2):142–164. - PubMed
Publication types
MeSH terms
Substances
Grants and funding
LinkOut - more resources
Full Text Sources
Molecular Biology Databases
Research Materials
