

The Apc(min) mouse has altered hematopoietic stem cell function and provides a model for MPD/MDS
- PMID: 20197553
- PMCID: PMC2867262
- DOI: 10.1182/blood-2009-11-251728
The Apc(min) mouse has altered hematopoietic stem cell function and provides a model for MPD/MDS
Erratum in
- Blood. 2014 Jan 9;123(2):301
Abstract
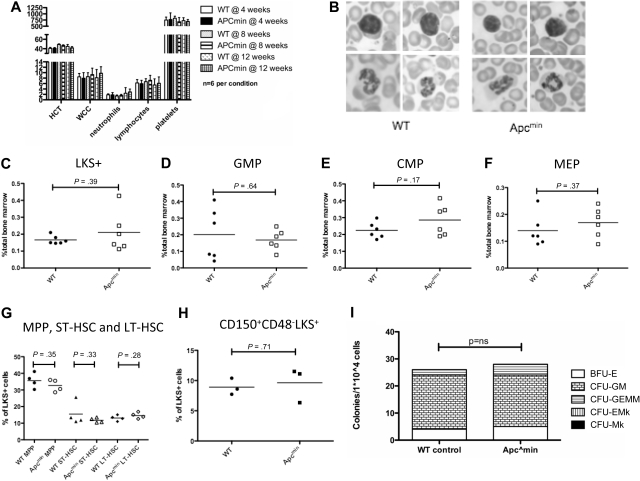
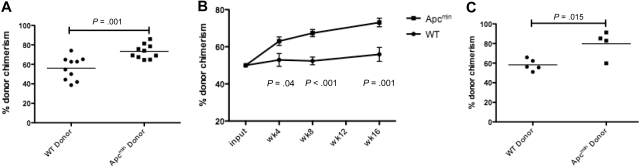
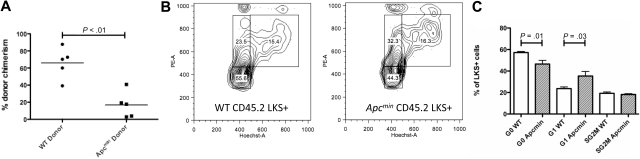
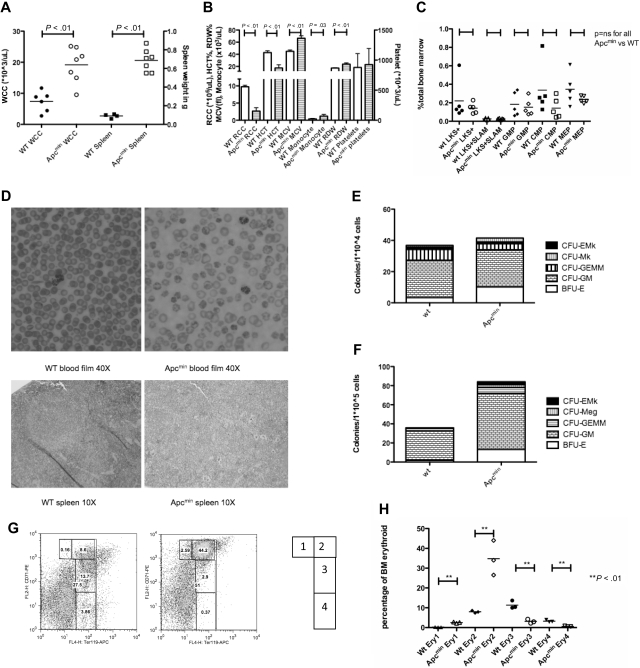
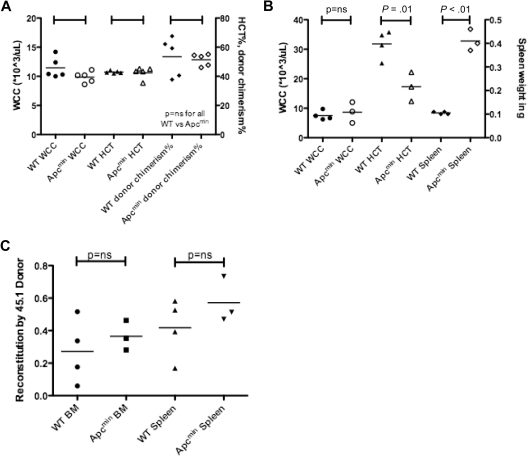
Apc, a negative regulator of the canonical Wnt signaling pathway, is a bona-fide tumor suppressor whose loss of function results in intestinal polyposis. APC is located in a commonly deleted region on human chromosome 5q, associated with myelodysplastic syndrome (MDS), suggesting that haploinsufficiency of APC contributes to the MDS phenotype. Analysis of the hematopoietic system of mice with the Apc(min) allele that results in a premature stop codon and loss of function showed no abnormality in steady state hematopoiesis. Bone marrow derived from Apc(min) mice showed enhanced repopulation potential, indicating a cell intrinsic gain of function in the long-term hematopoietic stem cell (HSC) population. However, Apc(min) bone marrow was unable to repopulate secondary recipients because of loss of the quiescent HSC population. Apc(min) mice developed a MDS/myeloproliferative phenotype. Our data indicate that Wnt activation through haploinsufficiency of Apc causes insidious loss of HSC function that is only evident in serial transplantation strategies. These data provide a cautionary note for HSC-expansion strategies through Wnt pathway activation, provide evidence that cell extrinsic factors can contribute to the development of myeloid disease, and indicate that loss of function of APC may contribute to the phenotype observed in patients with MDS and del(5q).
Figures
Similar articles
-
Haploinsufficiency of Apc leads to ineffective hematopoiesis.Blood. 2010 Apr 29;115(17):3481-8. doi: 10.1182/blood-2009-11-251835. Epub 2010 Jan 11. Blood. 2010. PMID: 20065296 Free PMC article.
-
Inhibition of WNT signaling in the bone marrow niche prevents the development of MDS in the Apcdel/+ MDS mouse model.Blood. 2017 Jun 1;129(22):2959-2970. doi: 10.1182/blood-2016-08-736454. Epub 2017 Mar 27. Blood. 2017. PMID: 28348148 Free PMC article.
-
β-Catenin Is a Candidate Therapeutic Target for Myeloid Neoplasms with del(5q).Cancer Res. 2017 Aug 1;77(15):4116-4126. doi: 10.1158/0008-5472.CAN-17-0202. Epub 2017 Jun 13. Cancer Res. 2017. PMID: 28611040 Free PMC article.
-
Deletion 5q MDS: molecular and therapeutic implications.Best Pract Res Clin Haematol. 2013 Dec;26(4):365-75. doi: 10.1016/j.beha.2013.10.013. Epub 2013 Oct 16. Best Pract Res Clin Haematol. 2013. PMID: 24507813 Review.
-
Aging, hematopoiesis, and the myelodysplastic syndromes.Hematology Am Soc Hematol Educ Program. 2017 Dec 8;2017(1):73-78. doi: 10.1182/asheducation-2017.1.73. Hematology Am Soc Hematol Educ Program. 2017. PMID: 29222239 Free PMC article. Review.
Cited by
-
High Levels of Canonical Wnt Signaling Lead to Loss of Stemness and Increased Differentiation in Hematopoietic Stem Cells.Stem Cell Reports. 2016 May 10;6(5):652-659. doi: 10.1016/j.stemcr.2016.04.009. Stem Cell Reports. 2016. PMID: 27167156 Free PMC article.
-
Epigenetics of myelodysplastic syndromes.Leukemia. 2014 Mar;28(3):497-506. doi: 10.1038/leu.2013.343. Epub 2013 Nov 19. Leukemia. 2014. PMID: 24247656 Review.
-
Unraveling the molecular pathophysiology of myelodysplastic syndromes.J Clin Oncol. 2011 Feb 10;29(5):504-15. doi: 10.1200/JCO.2010.31.1175. Epub 2011 Jan 10. J Clin Oncol. 2011. PMID: 21220588 Free PMC article. Review.
-
Genetic barcoding systematically compares genes in del(5q) MDS and reveals a central role for CSNK1A1 in clonal expansion.Blood Adv. 2022 Mar 22;6(6):1780-1796. doi: 10.1182/bloodadvances.2021006061. Blood Adv. 2022. PMID: 35016204 Free PMC article.
-
Knockdown of Hspa9, a del(5q31.2) gene, results in a decrease in hematopoietic progenitors in mice.Blood. 2011 Feb 3;117(5):1530-9. doi: 10.1182/blood-2010-06-293167. Epub 2010 Dec 1. Blood. 2011. PMID: 21123823 Free PMC article.
References
-
- Staal FJ, Clevers HC. WNT signalling and haematopoiesis: a WNT-WNT situation. Nat Rev Immunol. 2005;5(1):21–30. - PubMed
-
- Su LK, Kinzler KW, Vogelstein B, et al. Multiple intestinal neoplasia caused by a mutation in the murine homolog of the APC gene. Science. 1992;256(5057):668–670. - PubMed
-
- Moser AR, Pitot HC, Dove WF. A dominant mutation that predisposes to multiple intestinal neoplasia in the mouse. Science. 1990;247(4940):322–324. - PubMed
-
- Coletta PL, Muller AM, Jones EA, et al. Lymphodepletion in the ApcMin/+ mouse model of intestinal tumorigenesis. Blood. 2004;103(3):1050–1058. - PubMed
MeSH terms
Substances
Grants and funding
LinkOut - more resources
Full Text Sources
Other Literature Sources
Medical
Molecular Biology Databases
Research Materials
Miscellaneous
