. 2010 Apr 22;115(16):3329-40.
doi: 10.1182/blood-2009-02-207225. Epub 2010 Mar 2.

Expression of the cytoplasmic NPM1 mutant (NPMc+) causes the expansion of hematopoietic cells in zebrafish

Affiliations

Expression of the cytoplasmic NPM1 mutant (NPMc+) causes the expansion of hematopoietic cells in zebrafish

Niccolò Bolli et al. Blood. .

Abstract

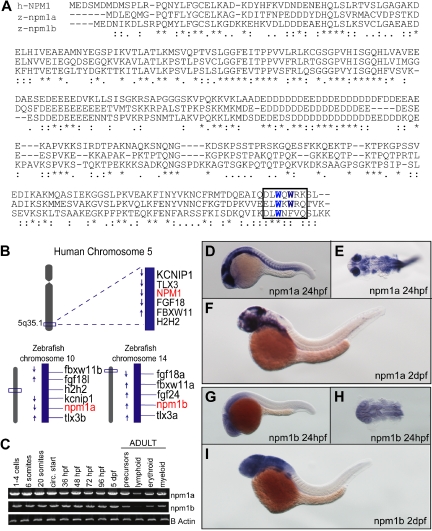
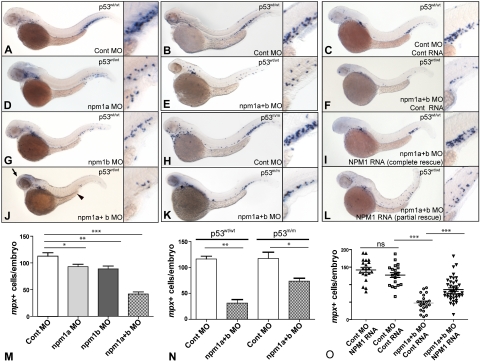
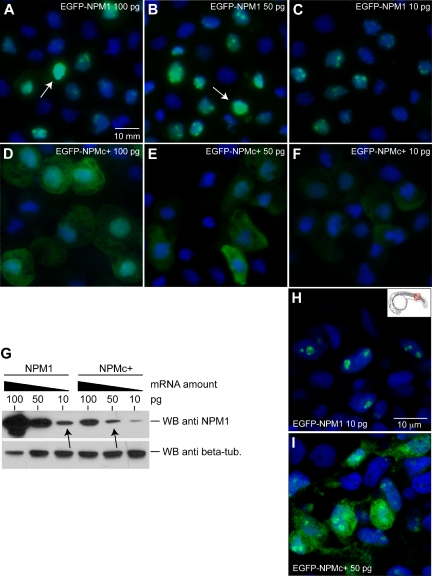
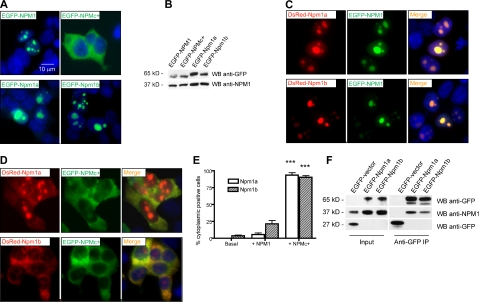
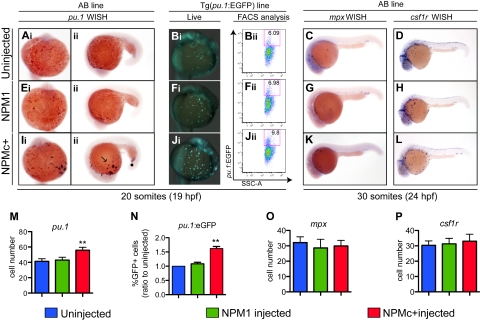
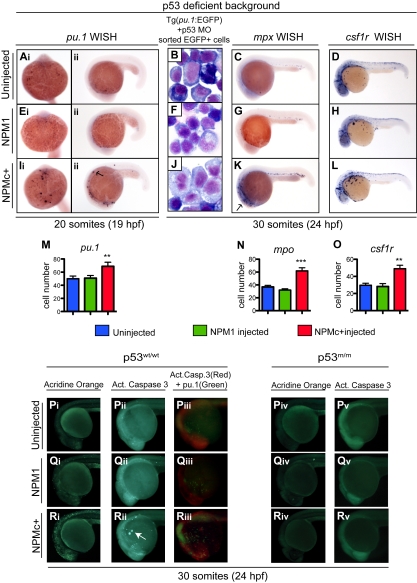
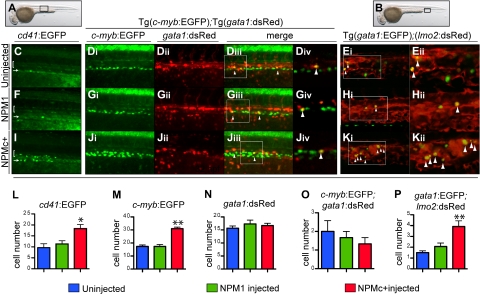
Mutations in the human nucleophosmin (NPM1) gene are the most frequent genetic alteration in adult acute myeloid leukemias (AMLs) and result in aberrant cytoplasmic translocation of this nucleolar phosphoprotein (NPMc+). However, underlying mechanisms leading to leukemogenesis remain unknown. To address this issue, we took advantage of the zebrafish model organism, which expresses 2 genes orthologous to human NPM1, referred to as npm1a and npm1b. Both genes are ubiquitously expressed, and their knockdown produces a reduction in myeloid cell numbers that is specifically rescued by NPM1 expression. In zebrafish, wild-type human NPM1 is nucleolar while NPMc+ is cytoplasmic, as in human AML, and both interact with endogenous zebrafish Npm1a and Npm1b. Forced NPMc+ expression in zebrafish causes an increase in pu.1(+) primitive early myeloid cells. A more marked perturbation of myelopoiesis occurs in p53(m/m) embryos expressing NPMc+, where mpx(+) and csf1r(+) cell numbers are also expanded. Importantly, NPMc+ expression results in increased numbers of definitive hematopoietic cells, including erythromyeloid progenitors in the posterior blood island and c-myb/cd41(+) cells in the ventral wall of the aorta. These results are likely to be relevant to human NPMc+ AML, where the observed NPMc+ multilineage expression pattern implies transformation of a multipotent stem or progenitor cell.


Figures

Figure 1
Figure 1
Identification of 2 putative zebrafish npm1 genes. (A) Clustal W alignment of human NPM1 (top row), zebrafish Npm1a (middle row), and Npm1b (bottom row) proteins. * indicates identical residues; colon (:), highly similar residues; and period (.), similar residues. Critical tryptophan residues necessary for nucleolar localization are highlighted in blue in the boxed area. (B) The genomic loci surrounding human NPM1 on chromosome 5q35.1 (top row) are syntenic with the regions where npm1a (on chromosome 10) and npm1b (on chromosome 14) are located in the zebrafish genome (bottom row left and right, respectively). (C) RT-PCRs showing npm1a (top row) and npm1b (middle row) expression levels. β-actin expression levels are used as a loading control (bottom row). Left: npm1a and npm1b embryonic expression was assessed from whole embryos at the indicated time points. Right: RT-PCRs from precursor, lymphoid, myeloid, and erythroid cells sorted from adult kidney marrow (gating strategy based on forward- and side-scatter plots). (D,F,G,I) npm1a or npm1b WISH assays in 24-hpf or 48-hpf embryos, lateral view, anterior to the left, dorsal upwards. (E,H) Close-up dorsal view (anterior to the left) of the brain and anterior trunk in flat-mounted, deyolked 24-hpf embryos stained with npm1a or npm1b probes. Digoxigenin-labeled RNA probes encoding the full-length npm1a and npm1b sequences were transcribed from linearized cDNA constructs using the DIG RNA labeling kit (Roche) following manufacturer instructions.
Figure 2
Figure 2
Knockdown of npm1a and npm1b leads to loss of myeloid cells. (A-L) WISH for mpx in 48-hpf embryos, lateral view, anterior to the left, dorsal upwards. (A,D,G,J,M) Knockdown of npm1 genes results in loss of mpx-expressing myeloid cells. A significant difference is seen in myeloid cell numbers when each gene is knocked-down individually (npm1a in panel D and npm1b in panel G, quantified in panel M); this effect is at least additive in the double knockdown (npm1a + npm1b in panel J, quantified in panel M). (B,E,H,K,N) mpx expression is reduced upon npm1 knockdown compared with controls in both the p53wt/wt (B,E) and p53m/m (H,K) backgrounds (quantified in panel N). (C,F,I,L,O) Loss of mpx expression by knockdown of npm1 (F) can be rescued completely (I) or partially (L) by NPM1 RNA injection (10 pg). No differential expression of mpx is observed when 10 pg NPM1 or 10 pg control RNA (C) are injected with a control MO (quantified in panel O). npm1a MO indicates 5′UTR MO (1.4 ng); npm1b MO, 5′UTR MO (1.4 ng); npm1(a+b), npm1a MO + npm1b MO (1.4 ng each); control MO, npm1a 5-bp mismatch + npm1b 5-bp mismatch at 1.4 ng each. Error bars represent SEM. ns indicates not significant; *P < .02; **P < .01; ***P < .001 (Student t test). Complete rescue in panel I is defined as mpx+ cell numbers per embryo greater than the lower limit of the 95% confidence interval of the control RNA/control MO-injected embryos. Partial rescue in panel L is defined as mpx+ cells/embryos greater than the upper limit of the 95% confidence interval of the npm1(a+b) MO but below the lower limit of the 95% confidence interval of the control RNA/control MO-injected embryos.
Figure 3
Figure 3
Mutated human NPM1 is aberrantly expressed in the cytoplasm of zebrafish cells. (A-F) Epifluorescence analysis of EGFP-NPM1 (A-C) and EGFP-NPMc+ (D-F) subcellular localization in cytospins of zebrafish cells after mRNA injection at the indicated amounts. NPM1 or NPMc+ proteins are shown in green, and nuclei are counterstained in blue with DAPI. Cells were visualized with a Zeiss Axio imager Z1 microscope using a Zeiss 63×/1.4 numeric aperture (NA) Apochromat oil lens (Carl Zeiss). Images were acquired with Openlab software (Perkin Elmer). (G) WB analysis of protein extracts from NPM1 (top left 3 lanes) and NPMc+ (top right 3 lanes) mRNA-injected embryos. NPM1 expression levels at each mRNA dose are shown along with β-tubulin expression as a loading control (bottom row). The arrows indicate the doses used for subsequent experiments. (H-I) Confocal microscopy of EGFP-NPM1 subcellular localization in zebrafish embryos at 24 hpf injected with 10 pg of EGFP-NPM1 mRNA (H) and 50 pg EGFP-NPMc+ mRNA (I). NPM1 protein is shown in green, while nuclei are counterstained in blue with DAPI. Images of cells were taken in the dorsal trunk region, shown in the insert (H), with a Zeiss LSM 510 META 2-Photon confocal microscope (Carl Zeiss), using a Zeiss 63×/1.4 NA Apochromat oil lens (Carl Zeiss). Images were acquired with the Zeiss LSM 510 software (Carl Zeiss). The EGFP expression patterns shown were representative of cells throughout the embryo.
Figure 4
Figure 4
Zebrafish npm1 orthologs interact with human NPM1 protein. (A) Epifluorescent images of 293T cells transfected with pEGFP-C1 expression vector encoding NPM1 (top left), NPMc+ (top right), Npm1a (bottom left), or Npm1b (bottom right). Expressed proteins are shown in green; nuclei are counterstained in blue with DAPI. (B) Anti-GFP WB analysis of protein lysates from transfected cells shown in Figure 2A. Levels of transfected proteins (top row) are shown along with levels of endogenous NPM1 (bottom row). (C) Epifluorescent images of 293T cells cotransfected with pEGFP-C1-NPM1 and pDsRed-monomer-C1 encoding zebrafish Npm1a (top row) or Npm1b (bottom row). Colocalization areas between Npm1a or Npm1b (in red, left column) and NPM1 (in green, middle column) are shown in yellow in the merged images (right column). Nuclei are counterstained in blue with DAPI. (D) Epifluorescent images of 293T cells cotransfected with pEGFP-C1-NPM1c+ and pDsRed-monomer-C1 encoding Npm1a (top row) or Npm1b (bottom row). Colocalization areas between Npm1a or Npm1b (in red, left column) and NPMc+ (in green, middle column) are shown in yellow in the merged images (right column). Nuclei are counterstained in blue with DAPI. All fluorescent images were acquired with a Zeiss Axio imager Z1 microscope using a Zeiss 63×/1.4 NA Apochromat oil lens (Carl Zeiss) and Openlab software (Perkin Elmer). (E) Quantification of the Npm1a and Npm1b delocalization by NPMc+. Bars indicate the percentage of cells with aberrant Npm1a (□) or Npm1b (▧) cytoplasmic expression (with or without residual nucleolar positivity). Error bars indicate SD. *Statistically significant differences between the NPMc+-injected and both NPM1-injected and uninjected embryos (***P < .001; Student t test). More than 200 cells were counted in 3 different microscopic fields for this analysis. (F) Anti-GFP coimmunoprecipitation assays of 293T cells transfected with the empty pEGFP-C1 vector, pEGFP-C1-Npm1a, or pEGFP-C1-Npm1b. Left panels, input; right panels, anti-GFP coimmunoprecipitation lanes. Top row: anti-GFP WB, detecting EGFP-Npm1a and EGFP-Npm1b fusion proteins. Middle row: anti-NPM1 WB, detecting endogenous NPM1. Bottom row: anti-GFP WB, detecting EGFP expressed by the empty vector. In the anti-GFP immunoprecipitation lanes, a dimmer band under the EGFP-Npm1a and EGFP-Npm1b bands probably represents a degradation product of the fusion protein, as it is also visible in the input lanes at longer exposures.
Figure 5
Figure 5
NPMc+ increases the number of primitive myeloid cells in zebrafish embryos. (Ai-Aii,Ei-Eii,Ii-Iii,M) WISH assays of AB embryos showing pu.1 expression at 20 somites (19 hpf) in ventral views, anterior to the top (A,E,Ii), and lateral views anterior to the left, dorsal upwards (Aii,Eii,Iii). pu.1-expressing cells are shown as dark purple dots that increase in number with NPMc+ expression (Ii-Iii). (M) pu.1+ cell number quantification shows a statistically significant increase upon NPMc+ expression (20 embryos counted per condition). (B,F,J) pu.1 expression analysis in the Tg(pu.1:EGFP) line at 20 somites (19 hpf). Ventral views, anterior to the top, of the ALPM and yolk of live Tg(pu.1:EGFP) transgenic zebrafish embryos, uninjected (Bi), or injected with NPM1 10 pg (Fi) or NPMc+ 50 pg (Ji) mRNA. Green cells indicate cells expressing EGFP under the control of the pu.1 promoter. NPMc+ expression causes a marked increase in EGFP+ cell numbers that disperse widely across the embryo's yolk (Ji). FACS analysis of Tg(pu.1:EGFP) embryos, uninjected (Bii), or injected with NPM1 10 pg (Fii) or NPMc+ 50 pg (Jii) mRNA. EGFP expression is shown in the y-axis and is increased upon NPMc+ expression (Jii). (N) Quantification of the percentage of EGFP+ cells in 3 independent FACS experiments, each including 50 heterozygous Tg(pu.1:EGFP) embryos per condition, normalized to the percentage of EGFP+ cells of uninjected embryos. (C-D, G-H, K-L, O-P) WISH assays showing lateral views (anterior to the left, dorsal upwards) of 30 somites (24 hpf) embryos stained for mpx (C,G,K) or csf1r expression (D,H,L). No significant change in expression of any of these markers is observed. The number of mpx and csf1r cells is quantified in panels O and P, respectively (20 embryos counted per condition). Note that the csf1r probe also stains xanthophores in the dorsal trunk of the embryo. In all graphs, error bars represent SEM. *Statistically significant differences between the NPMc+-injected and both NPM1-injected and uninjected embryos (**P < .005; Student t test). In histograms, blue indicates uninjected control embryos; green, NPM1-injected embryos; and red, NPMc+-injected embryos.
Figure 6
Figure 6
NPMc+ expression causes an increase in the number of primitive mpx+ and csf1r+ cells in the absence of functional p53 and causes p53-dependent apoptotic cell death. (Ai-Aii, Ei-Eii, Ii-Iii, M) pu.1 WISH assays in homozygous p53 mutant embryos at 20 somites (19 hpf), uninjected (Ai-Aii), or injected with NPM1 10 pg (Ei-Eii) or NPMc+ 50 pg (Ii-Iii). Embryos are shown in ventral (Ai,Ei,Ii; anterior to the top) and lateral (Aii,Eii,Iii; anterior to the left, dorsal upwards) views. pu.1-expressing cells are indicated by dark purple spots and are increased in embryos injected with NPMc+, 50 pg (Ii-Iii). (M) pu.1+ cell number quantification shows a statistically significant increase upon NPMc+ expression (20 embryos counted per condition). (B,F,J) Giemsa stain of cystospins of EGFP+ cells sorted from Tg(pu.1:EGFP) embryos at 30 somites (24 hpf), injected with p53 MO 1.6 ng alone (B) or in combination with either NPM1 10 pg (F) or NPMc+ 50 pg (J). NPMc+ expression results in larger cells with more immature morphology (J). Images were acquired with a Zeiss Axio imager Z1 microscope using a Zeiss 63×/1.4 NA Apochromat Oil lens (Carl Zeiss) and Openlab software (Perkin Elmer). (C-D, G-H, K-L, N-O) mpx (C,G,K) and csf1r (D,H,L) WISH are shown in lateral views (anterior to the left, dorsal upwards) of homozygous p53 mutant embryos at 30 somites (24 hpf) uninjected (C-D) or injected with NPM1 10 pg (G-H) or NPMc+ 50 pg (K-L). Note that mpx and csf1r expression is markedly expanded upon NPMc+ expression and p53 loss (K-L). The number of mpx and csf1r cells is quantified in panels N and O, respectively (20 embryos counted per condition). Note that the csf1r probe also stains xanthophores in the dorsal trunk of the embryo. Error bars represent SEM. *Statistically significant differences between the NPMc+-injected and both NPM1-injected and uninjected embryos (**P < .005; ***P < .001; Student t test). In histograms, blue indicates uninjected control embryos; green, NPM1-injected embryos; and red, NPMc+-injected embryos. (P-R) Wild-type p53 embryos are shown either uninjected (Pi-Piii), or expressing NPM1 (Qi-Qiii) or NPMc+ (Ri-Riii). All embryos are at 30 somites (24 hpf) and shown in lateral views of the head and anterior trunk, anterior to the left and dorsal upwards. Acridine orange staining (green indicate dead or dying cells) of embryos uninjected (Pi), or injected with NPM1 10 pg (Qi) or NPMc+ 50 pg (Ri) mRNA. An increase in dying cells is observed upon NPMc+ expression (Ri). Activated caspase-3 immunostaining (green indicates cells in apoptosis) of embryos uninjected (Pii), or injected with NPM1 10 pg (Qii) or NPMc+ 50 pg (Rii) mRNA. Increased numbers of apoptotic cells are observed in NPMc+-injected embryos (Rii), forming aggregates on the yolk (arrow). Anti–activated caspase-3 and anti-GFP immunostaining in Tg(pu.1:EGFP) transgenic embryos (red spots indicate cells that express the cleaved form of caspase-3, and green spots indicate cells expressing EGFP under the control of the pu.1 promoter), uninjected (Piii), or injected with NPM1 10 pg (Qiii) or NPMc+ 50 pg (Riii) mRNA. Note in panel Riii the increase in activated caspase-3–expressing cells that surround and lie adjacent to EGFP+ cells, but do not colocalize with them. Homozygous mutant p53 embryos are shown uninjected (Piv-Pv), or expressing either NPM1 (Qiv-Qv) or NPMc+ (Riv-Rv). All embryos are at 30 somites (24 hpf) shown in lateral views of the head and anterior trunk, anterior to the left and dorsal upwards. Acridine orange staining of embryos uninjected (Piv) or injected with NPM1 10 pg (Qiv) or NPMc+ 50 pg mRNA (Riv) show no difference in the number of dead or dying cells. Anti–activated caspase-3 staining of embryos uninjected (Pv) or injected with either NPM1 10 pg (Qv) or NPMc+ 50 pg (Rv) mRNA show no difference in the number of apoptotic cells. Embryos were equilibrated in glycerol and visualized with a Nikon SMZ1500 zoom stereomicroscope (Nikon) using a 488 nm filter for the EGFP signal and 568 nm filter for the red signal. Images were acquired with NIS-Elements software (Nikon).
Figure 7
Figure 7
NPMc+ increases the number of definitive hematopoietic cells in zebrafish embryos. (A-B) Brightfield images of a 32-hpf embryo (lateral view, anterior to the left, dorsal upwards) where a black box shows the region of the AGM (A) or of the PBI (B), where subsequent images were taken. (C,F,I,L) Confocal images taken from the AGM region of live 32-hpf Tg(cd41:EGFP) transgenic zebrafish embryos (black box in panel A), uninjected (C), or injected with NPM1 10 pg (F) or NPMc+ 50 pg (I) mRNA. Green cells indicate expression of EGFP under the control of the cd41 promoter. The bracket highlights cd41low EGFP+ cells in the AGM region, while the arrow points at the renal EGFP+ population located in the region of the pronephric ducts. EGFP+ cells in the AGM field were counted and showed increased numbers upon NPMc+ expression (L). Images were captured on a Yokogawa spinning disk confocal microscope using a 10×/0.3 NA Plan-fluor phase objective. (Di-iv, Gi-iv, Ji-iv, M-O) Confocal images taken from the AGM region of live 32-hpf Tg(c-myb:EGFP);(gata1:DsRed) transgenic zebrafish embryos (black box in panel A), uninjected (Di-Div), or injected with NPM1 10 pg (Gi-Giv) or NPMc+ 50 pg (Ji-Jiv) mRNA. Green indicates cells expressing EGFP under the control of the c-myb promoter; red indicates cells expressing DsRed under the control of the gata1 promoter; yellow indicates cells coexpressing both genes (highlighted by arrowheads). The white boxes in panels Diii, Giii, and Jiii indicate an area, magnified in a single Z-stack slice (Div,Giv,Jiv), showing how single slices were used to quantify the number of yellow cells. NPMc+ expression causes an increase in EGFP+ cell numbers in the field of analysis (quantified in panel M) without affecting numbers of cells expressing DsRed under the control of the gata1 promoter (quantified in panel N) or double-positive cells (quantified in panel O by counting yellow cells in 3 different Z-stack slices in each of 4 embryos). Images were taken as for Tg(cd41:EGFP) embryos. (E,H,K,P) Confocal images taken from the PBI region of live 32-hpf Tg(gata1:EGFP);(lmo2:DsRed) transgenic zebrafish embryos (black box in panel B), uninjected (E), or injected with NPM1 10 pg (H) or NPMc+ 50 pg (K) mRNA. Green indicates cells expressing EGFP under the control of the gata1 promoter; red indicates cells expressing DsRed under the control of the lmo2 promoter; yellow indicates cells coexpressing both genes (highlighted by arrowheads). NPMc+ expression causes an increase in cells expressing both genes (K), quantified in panel P by counting yellow cells in 3 different Z-stack slices in each of 4 embryos. Images are single Z-stack slices, and the white boxes in panels Ei, Hi, and Ki indicates an area magnified in panels Eii, Hii, and Kii. Images were acquired on a Yokogawa spinning disk confocal microscope using a 20×/0.75 NA Plan-Apo DIC objective. All confocal images were acquired using the Andor IQ software. Analysis of images was performed using ImageJ software. Error bars represent SEM. *Statistically significant differences between the NPMc+-injected and both NPM1-injected and uninjected embryos (*P < .05, **P < .005; Student t test). In histograms blue indicates uninjected control embryos; green, NPM1-injected embryos; and red, NPMc+-injected embryos.

Similar articles

Cited by

References

    1. Grisendi S, Mecucci C, Falini B, Pandolfi PP. Nucleophosmin and cancer. Nat Rev Cancer. 2006;6(7):493–505. - PubMed
    1. Bertwistle D, Sugimoto M, Sherr CJ. Physical and functional interactions of the Arf tumor suppressor protein with nucleophosmin/B23. Mol Cell Biol. 2004;24(3):985–996. - PMC - PubMed
    1. Korgaonkar C, Hagen J, Tompkins V, et al. Nucleophosmin (B23) targets ARF to nucleoli and inhibits its function. Mol Cell Biol. 2005;25(4):1258–1271. - PMC - PubMed
    1. Colombo E, Marine JC, Danovi D, Falini B, Pelicci PG. Nucleophosmin regulates the stability and transcriptional activity of p53. Nat Cell Biol. 2002;4(7):529–533. - PubMed
    1. Wu MH, Yung BY. UV stimulation of nucleophosmin/B23 expression is an immediate-early gene response induced by damaged DNA. J Biol Chem. 2002;277(50):48234–48240. - PubMed

Publication types

MeSH terms